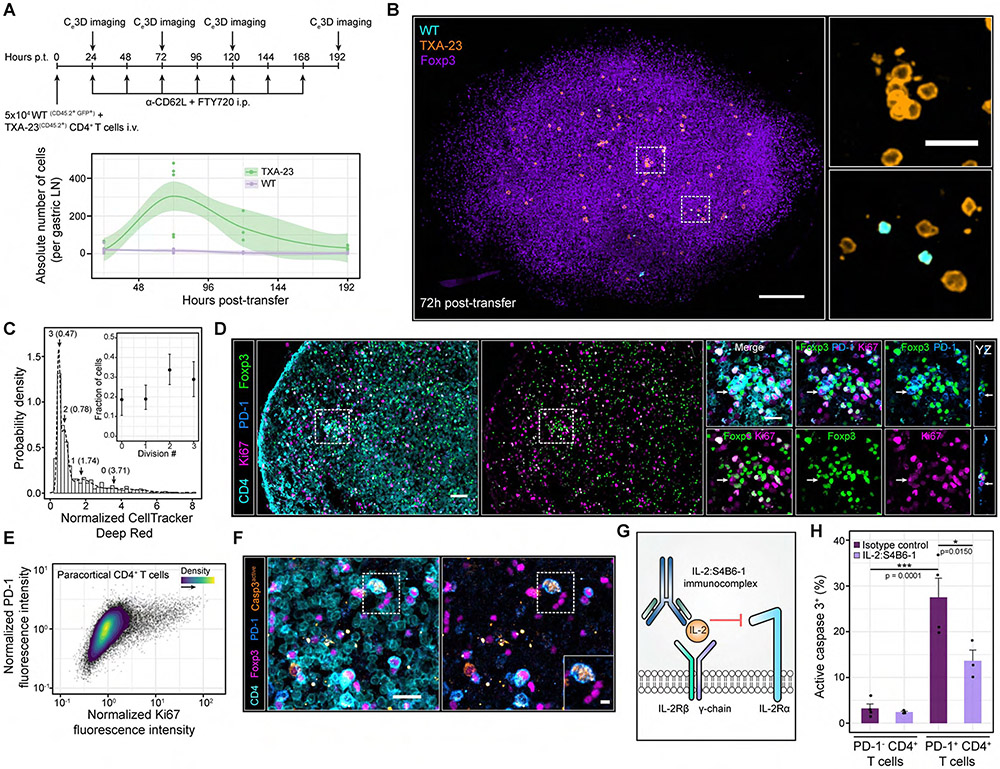
Figure 3. Self-activated T cells proliferate despite local IL-2 constraints but are rapidly pruned from the host.
(A) Top panel: experimental schematic. Bottom panel: absolute number of cells per gastric LN. Each dot represents a LN from a single mouse. Local regressions with 95% confidence intervals are shown for each cell type over time. Gastric LNs from n = 3-8 mice were imaged at each time point. Data are pooled from 2-3 independent experiments (B) Ce3D imaging of the gastric LN at 72h post-transfer. Insets: magnified ROIs (white dashed boxes). Scale bars = 100 μm and 20 μm (Inset) (C) In situ quantification of TxA23 cell proliferation at 96h post-transfer without FTY-720 and anti-CD62L antibodies. A Gaussian mixture model (GMM) was fit to the CellTracker DeepRed distribution. k = 552 TxA23 cells pooled from gastric LNs of n = 4 animals. Data are from two independent experiments. Inset: fraction of TxA23 cells within each mixture component. Data are Mean ± 95% confidence intervals (D) Ki67 expression in paracortical CD4+ T cells. Left side: PD-1+ CD4+ T cells surrounded by high densities of Tregs. Right side: Magnified image gallery of the ROI (white dashed box). Arrows: PD-1+ CD4+ T cells enriched in Ki67. Scale bar = 40 μm and 20 μm (ROI). (E) Ki67 versus PD-1 expression in paracortical CD4+ T cells of GF C57BL/6 nice. Data are representative of 3 independent experiments. (F) Enriched active caspase 3 expression in a PD-1+ CD4+ T cell. Inset: magnified ROI (white dashed box). Scale bars = 20 μm and 5 μm (inset). (G) IL-2:S4B6-1 innunoconplex schematic. (H) In situ quantification of active caspase 3+ cells. Data are mean ± SEM. Each dot represents an individual nouse pooled from 2 independent experiments. p values determined using a one-way ANOVA with the Tukey correction.

