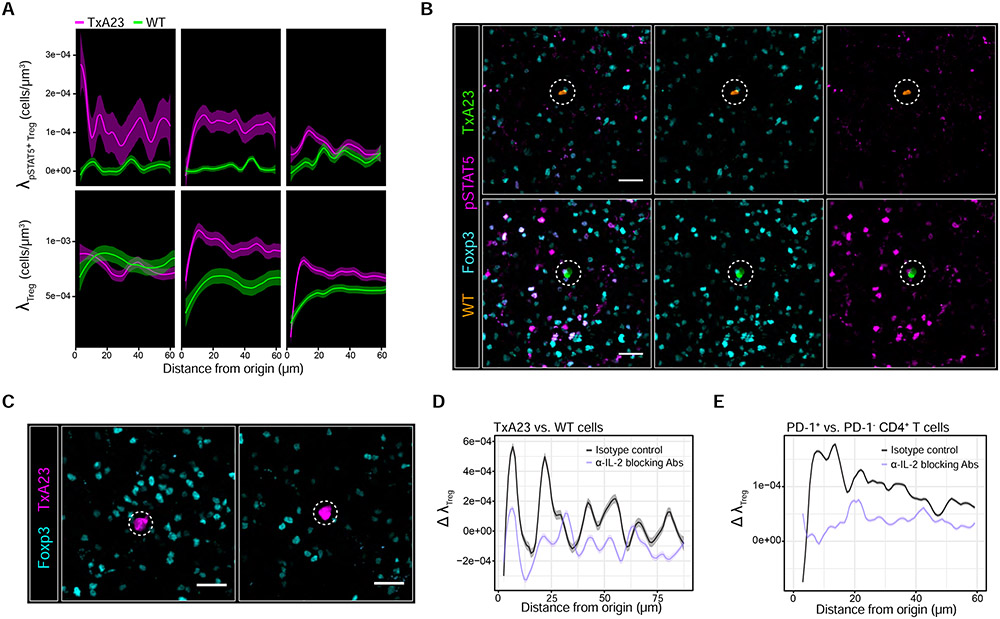
Figure 4. Treg micro-domain formation is part of the IL-2-driven feedback process.
(A) 1x10⁵ TxA23 cells and WT cells were co-transferred into BALB/c recipients. Local densities of pSTAT5+ Tregs (λpSTAT5+Treg - top panel) and total Tregs (λTreg – bottom panel) surrounding individual TxA23 cells (nagenta) or WT cells (green). Local regressions with 95% confidence intervals determined by the LOESS method. k = 25-150 cells pooled from gastric LN sections of n = 4-6 animals at each tine point. Data are from 2 independent experiments. (B) pSTAT5 signal in Tregs surrounding a WT cell (top panel) or TxA23 cell (bottom panel) in the sane gastric LN 24h post-transfer. Scale bar = 20 μm. (C) Adoptive transfers performed as in Figure 3A while co-injecting IL-2 blocking Abs or isotype controls. Gastric LNs harvested 24h post-transfer. Scale bar = 20 μm (D) Maximum deviation in λTreg (Δ λTreg) between TxA23 vs. WT cells 24h after injecting IL-2 blocking Abs or isotype controls (E) Δ λTreg between PD1+ CD4+ T cells vs. randomly sampled PD-1− CD4+ T cells 24h after injecting C57BL/6 nice with IL-2 blocking Abs or isotype controls. For D and E, 95% confidence intervals were derived by non-parametric bootstrapping. Data are from 2 independent experiments.

