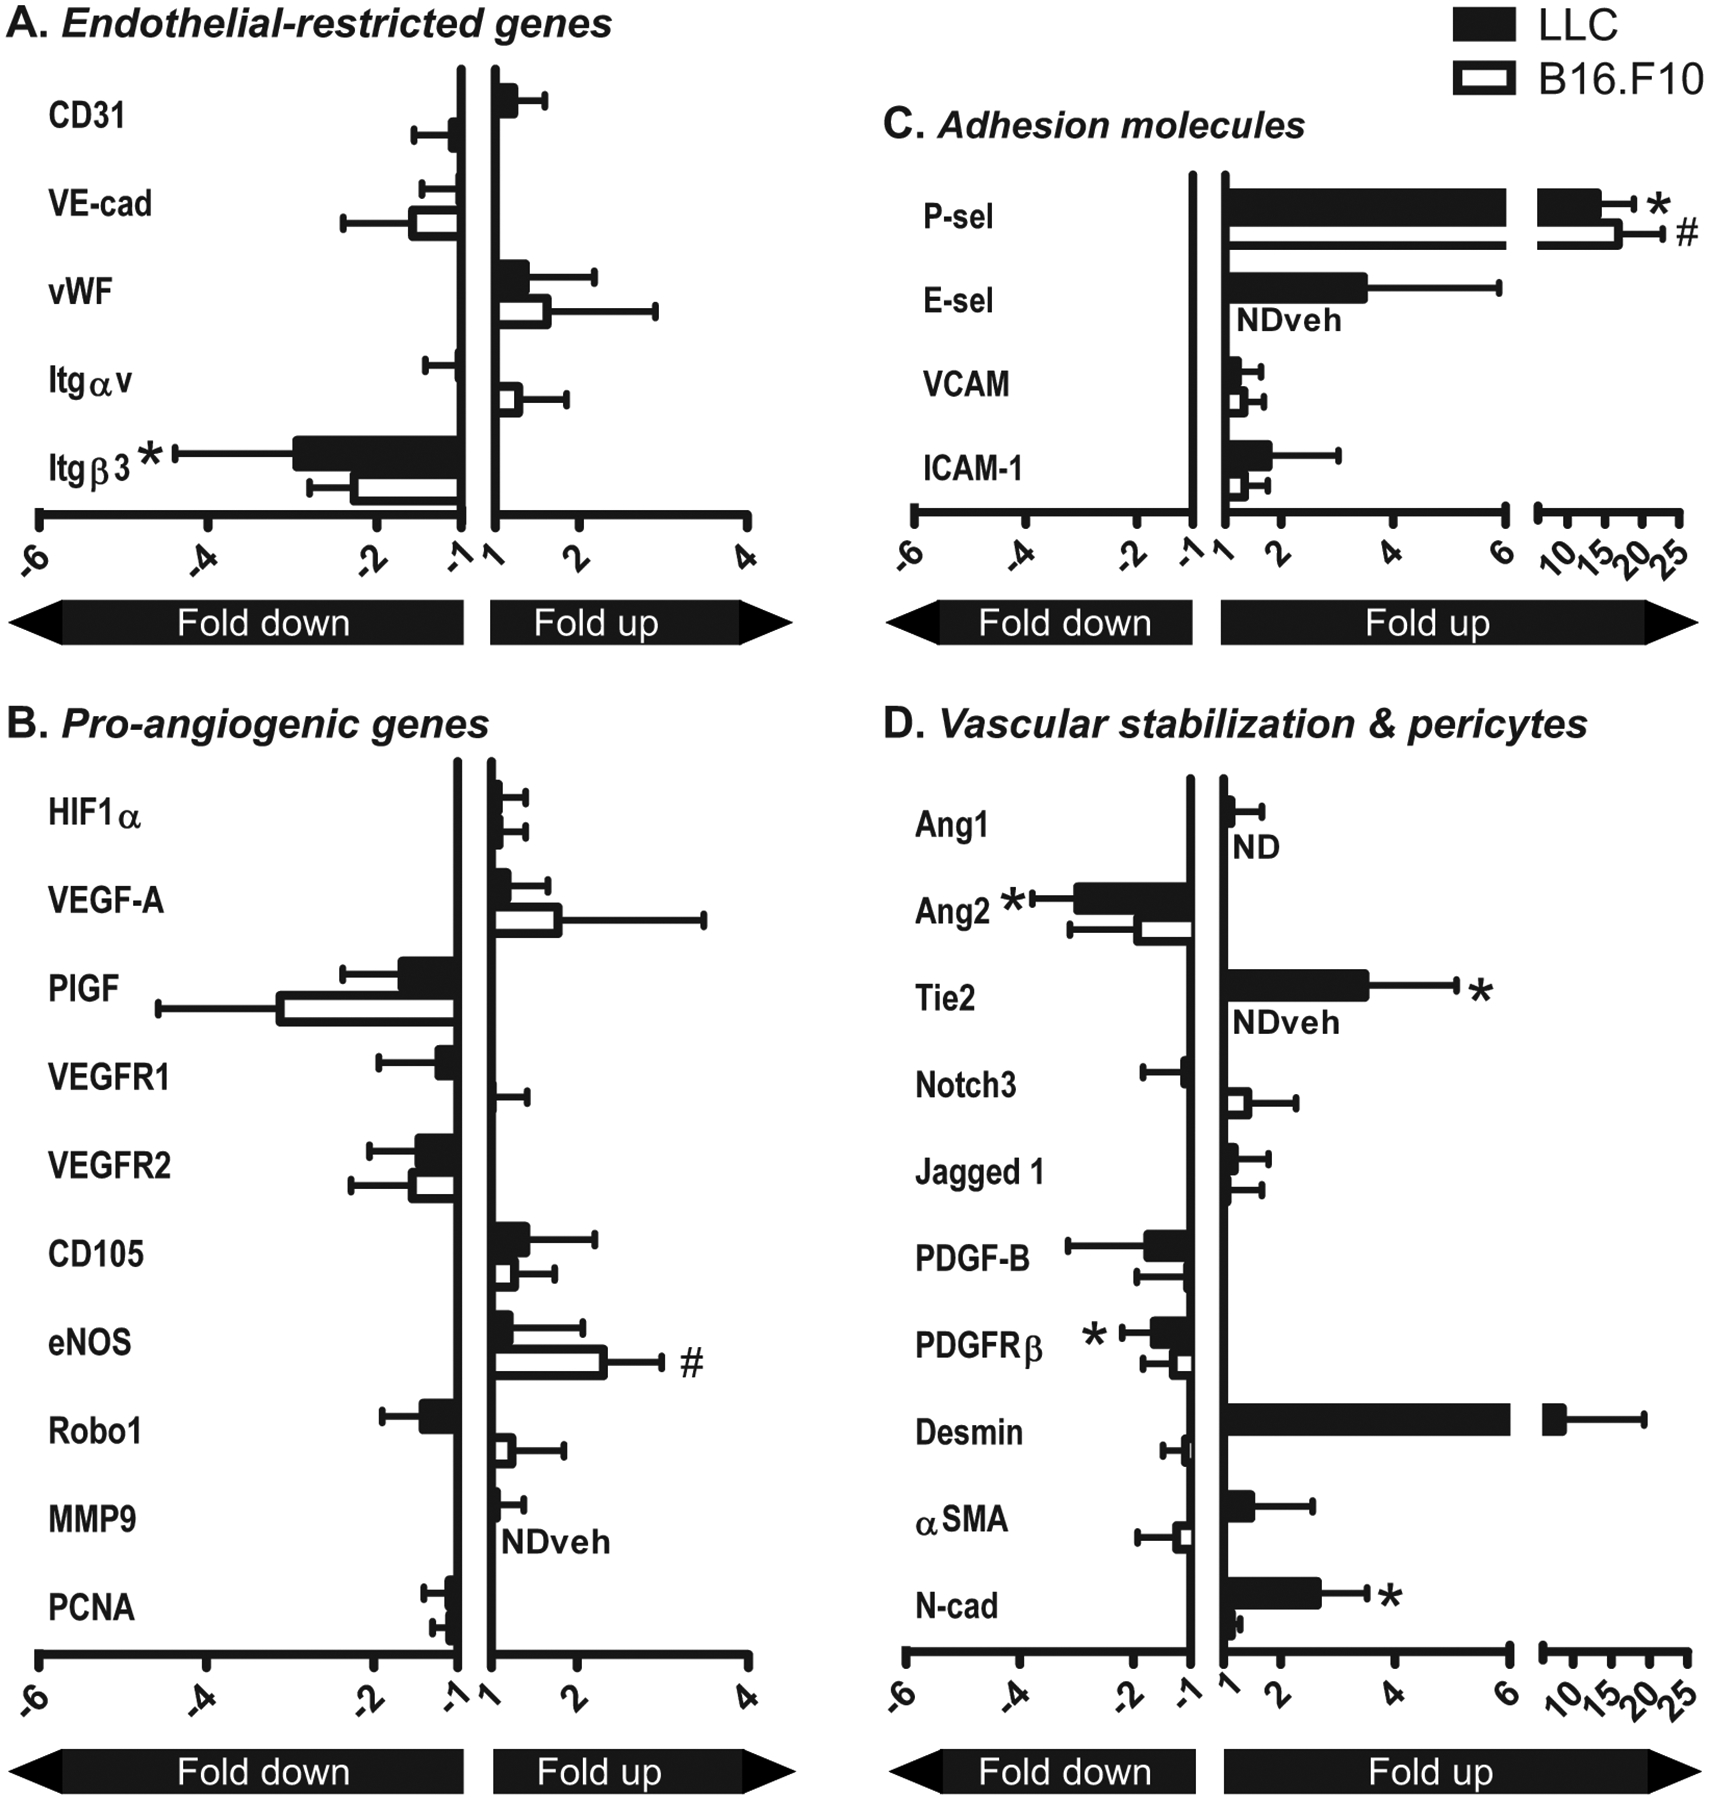
Figure 3: Vandetanib-induced changes in gene expression in LLC and B16.F10 tumor vasculature.

A–D: mRNA expression levels of various angiogenesis-associated and vascular behavior-determining genes in tumor vasculature that was isolated by laser microdissection from LLC and B16.F10 tumors treated with vandetanib or vehicle alone. Values represent fold increase or decrease in mRNA expression in the vasculature of vandetanib-treated tumors compared to vehicle-treated tumors, normalized to GAPDH. Mean + SD of 6 (LLC) or 5 (B16.F10) animals per group. NDveh = not detectable in the vehicle-treated mice, no ratio could be calculated. ND = not detectable in both vehicle- and vandetanib-treated group. *p<0.05 vs vehicle-treated control.
