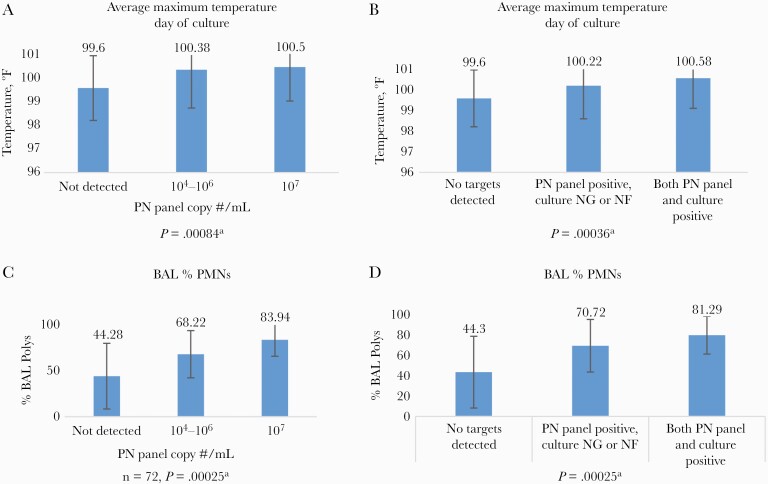
Figure 1.
A and B show the relationship of the group average maximum temperature in ºF on the day of the culture, when the patients were divided by copy number (A) and by PN Panel targets detected (B) when cultures were either uninformative (no growth or normal flora) or were consistent between the PN Panel detection and the culture result. C and D show % BAL PMNs reported from the Hematology lab when the patients were divided into the same respective groups as in (A) and (B). aMultiple 1-way ANOVA, with Bonferroni correction for multiple variables. Abbreviations: ANOVA, analysis of variance; BAL, bronchoalveolar lavage; PMNs, polymorphonuclear leukocytes.

