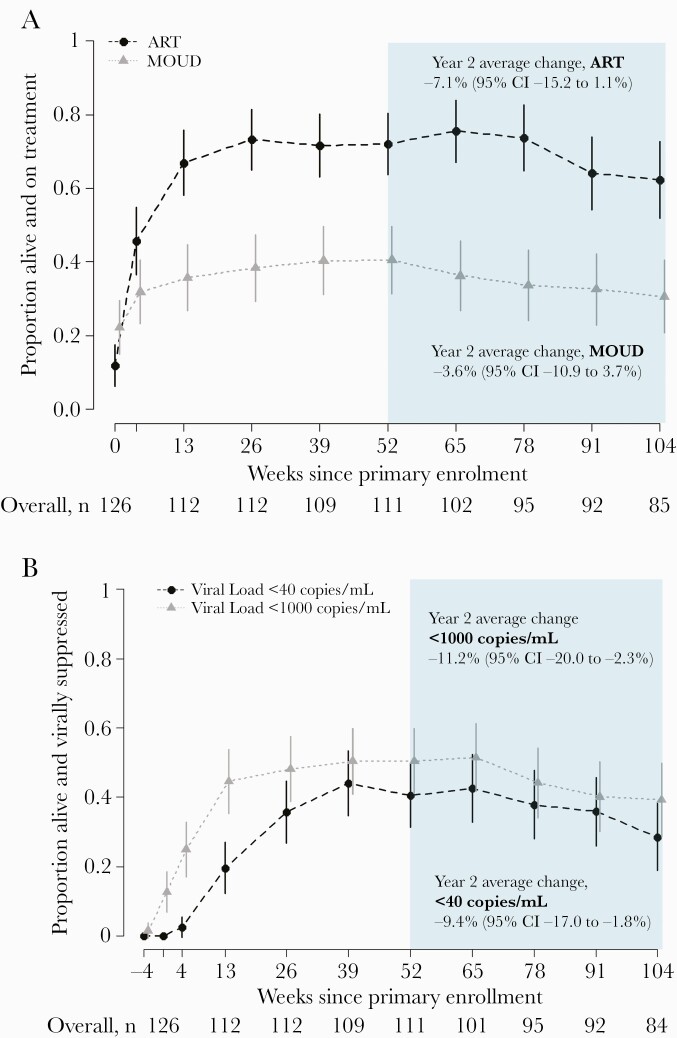
Figure 2.
Proportion of intervention continuation participants on treatment (A) and virally suppressed (B) by study week (n = 126). Weeks since primary study enrollment is displayed on the x-axis, with year 2 of follow-up in the shaded region. The proportion of participants who were alive and on treatment is shown on the y-axis with a corresponding 95% confidence interval at each follow-up. Abbreviations: ART, antiretroviral therapy; CI, confidence interval; MOUD, medication for opioid use disorder.

