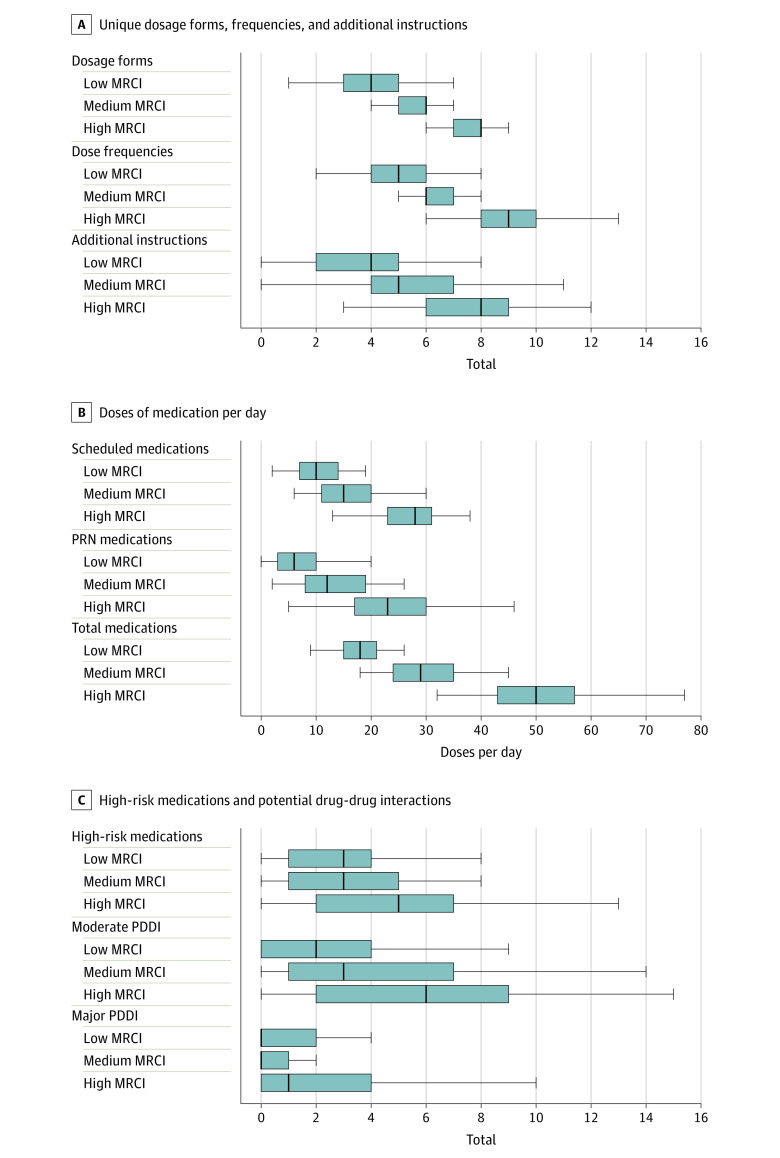
Figure 3. Characteristics of Complex Medication Regimens at the Patient Level by Medication Regimen Complexity Index (MRCI) Tertile in Children With Severe Neurological Impairment.
In the box plots, lines within boxes denote medians, ends of boxes denote interquartile ranges, and error bars denote the lower and upper adjacent values. Panel A displays counts for unique dosage forms per patient, dose frequencies per patient, and additional instructions per patient. Panel B displays counts for scheduled medication doses per patient per day excluding as-needed (PRN) medications, PRN medications per patient per day, and total doses per patient per day. Panel C displays counts for high-risk medications per patient, and moderate and major potential drug-drug interactions per patient. All comparisons across MRCI score groups were significant (P < .05, nonparametric tests of trend).

