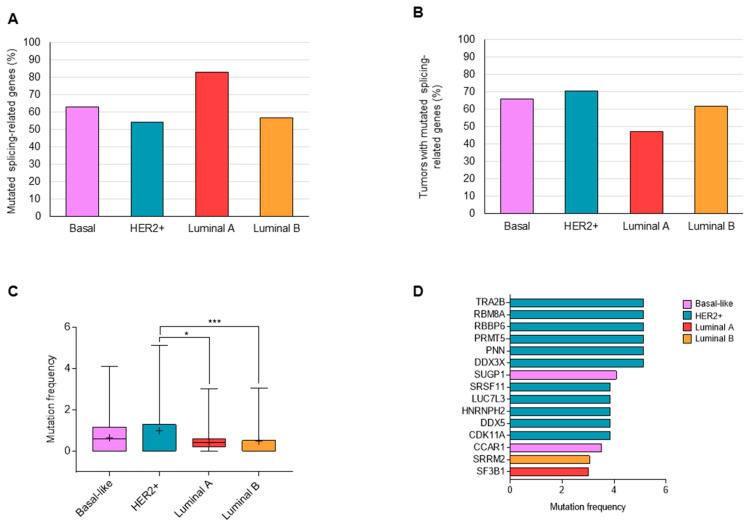
Figure 1.
Percentage of splicing-related genes showing mutations in each molecular subtype (A). Percentage of tumors with at least one mutated splicing-related gene (B). Frequency of non-synonymous mutations in splicing-related genes in each molecular subtype (C). List of splicing-related genes mutated in >3% of tumors (D). *: p < 0.05; ***: p < 0.001.

