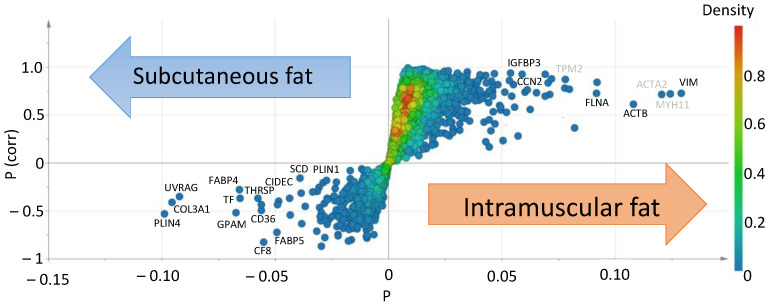
Figure 2.
Comparison of gene expression between intramuscular fat and subcutaneous fat. S-shaped plot for the OPLS-DA model, which was calculated based on RNA-seq data. The horizontal axis p is a variable that indicates the measure of correlation obtained with OPLS-DA analysis. The vertical axis p (corr) is an abbreviation for p scaled by the correlation coefficient, which is the loading of each variable scaled as a correlation coefficient and standardized in the range of −1 to +1. P (corr) indicates the relationship between intramuscular fat or subcutaneous fat, either positive or negative. The plot shows variable genes in subcutaneous fat (left) and intramuscular fat (right). The names of highly expressed genes in adipocytes are in black, and those of highly expressed genes in muscle fibers are in gray. R2X = 0.228, and scaling sets par type. The scores for the OPLS-DA model were R2 (cum) = 0.969 and Q2 (cum) = 0.788. The different colors in the plot indicate differences in density. The density bar on the right shows the color of the degree of density of the plot.

