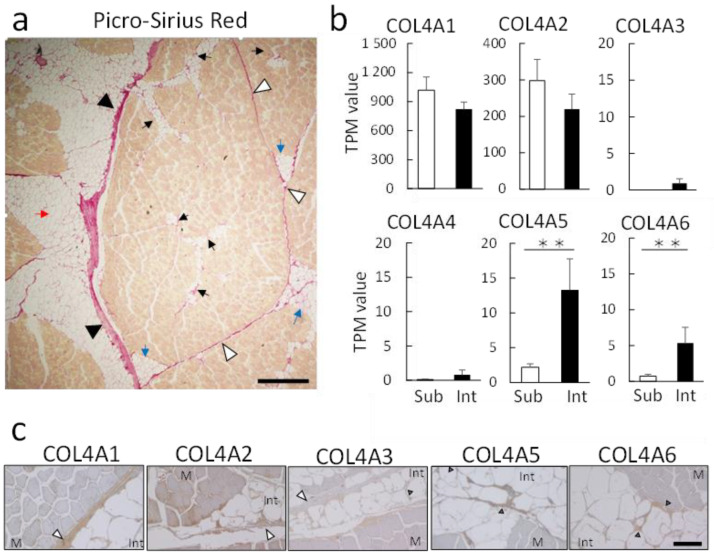
Figure 5.
A network of COL4A in the basement membrane of intramuscular fat. (a) Paraffin-embedded sections were prepared from the musculus longissimus lumborum of Japanese Black cattle. Picro-Sirius Red staining showing collagen (red) and muscle (yellow) fibers. Arrow indicates intramuscular adipocytes. The red arrow indicates the large intramuscular fat around the epimysium. Blue arrows indicate relatively thin intramuscular fat around the perimysium. Black arrows indicate the micro-intramuscular fat around the endomysium in the muscle bundle. Black arrowheads indicate the epimysium, white arrowheads indicate the perimysium, and gray arrowheads indicate the thickened basement membrane of the endomysium. Size bar, 500 μm. (b) Comparative analysis of COL4A expression by TPM values. Graphs show the TPM values obtained by RNA-seq analysis. Data represent the mean ± standard error (n = 3). ** p < 0.01, (c) Tissue immunostaining for COL4A family proteins in paraffin sections of muscle tissue from Japanese Black cattle. DAB staining (brown) was performed using primary antibodies targeting specific isoforms, with hematoxylin used for counterstaining. White arrowheads indicate perimysium, and gray arrowheads indicate endomysium. Size bar, 100 μm. Int, intramuscular adipocytes; M, muscle tissue.

