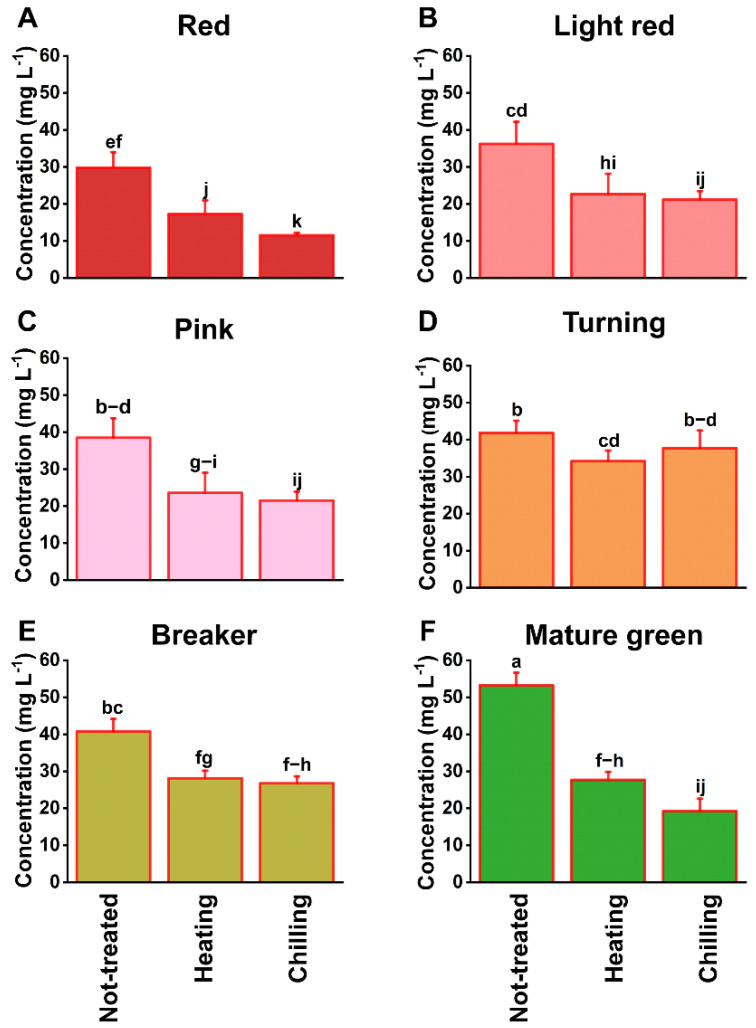
Figure 3.
Effect of postharvest temperature treatments on the concentration of flavor compounds (mg L−1) in ripe tomatoes harvested at six maturities: (A) red, (B) light red, (C) pink, (D) turning, (E) breaker, and (F) mature green. Each value is the mean of five replicates of three fruits each. Vertical bars represent the standard deviation of the means. The effect of “maturity × treatment” interaction was tested by two-way ANOVA (p < 0.05). Different letters on the top of columns represent significant differences between maturity × treatments combined using the Duncan’s multiple range test based on the interaction (p < 0.05).

