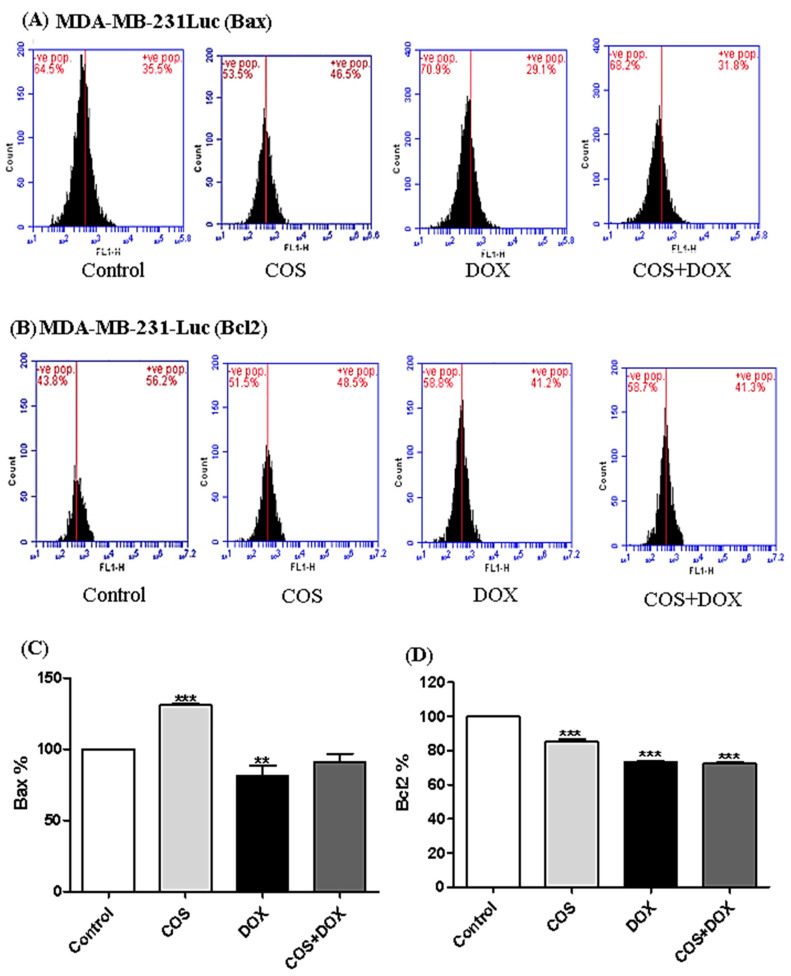
Figure 4.
Bcl2-associated X protein (Bax) and B-cell lymphoma 2 (Bcl2) protein expressions in MDA-MB-231-Luc. (A) Bax flow cytometer histogram. (B) Bcl2 flow cytometer histogram. (C) Bax percentages in costunolide (COS), doxorubicin (DOX), and costunolide + doxorubicin (COS + DOX) relative to the control group. (D) Bcl2 percentages in COS, DOX, and COS + DOX relative to the control group. Values are presented as mean ± SD. ** p < 0.01 and *** p < 0.001.

