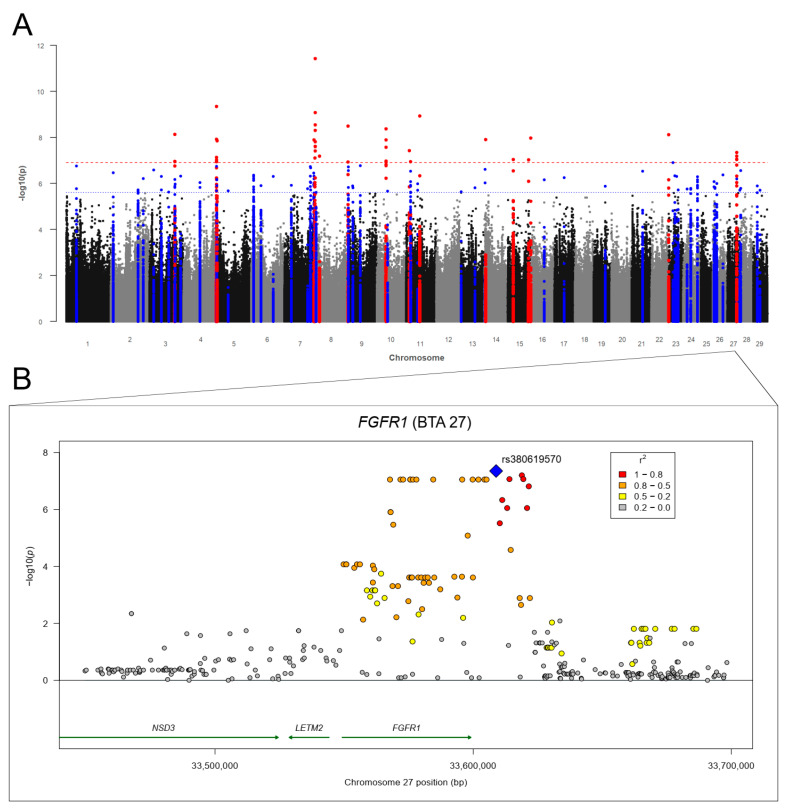
Figure 4.
(A) Manhattan plot for −log10 p-values of marker effects for residuals of fecal egg counts of Fasciola hepatica (RES-FH); markers above the genome-wide significance threshold pBonf (red dashed line) are highlighted in red and markers above the suggestive significance threshold pSug (blue dashed line) are highlighted in blue. Markers within a distance of 125 kb up- and downstream of significantly or suggestively associated SVs are highlighted in red or blue, respectively. (B) Regional association plot for the fibroblast growth factor receptor 1 (FGFR1) gene on BTA 27 with corresponding flanking regions (+/−100,000 bp). The SNP rs380619570 (blue square) was the highest associated SNP (p = 4.48 × 10⁻⁸) for RES-FH on BTA 27. Circles show GWAS p-values, with different colors indicating linkage disequilibrium (LD): red: LD 0.8 to 1.0, orange: LD 0.5 to 0.8. yellow: LD 0.2 to 0.5, gray: LD 0.0 to 0.2. Genes with a green arrow pointing to the right are located on the forward strand, genes with an arrow pointing to the left are located on the reverse strand.

