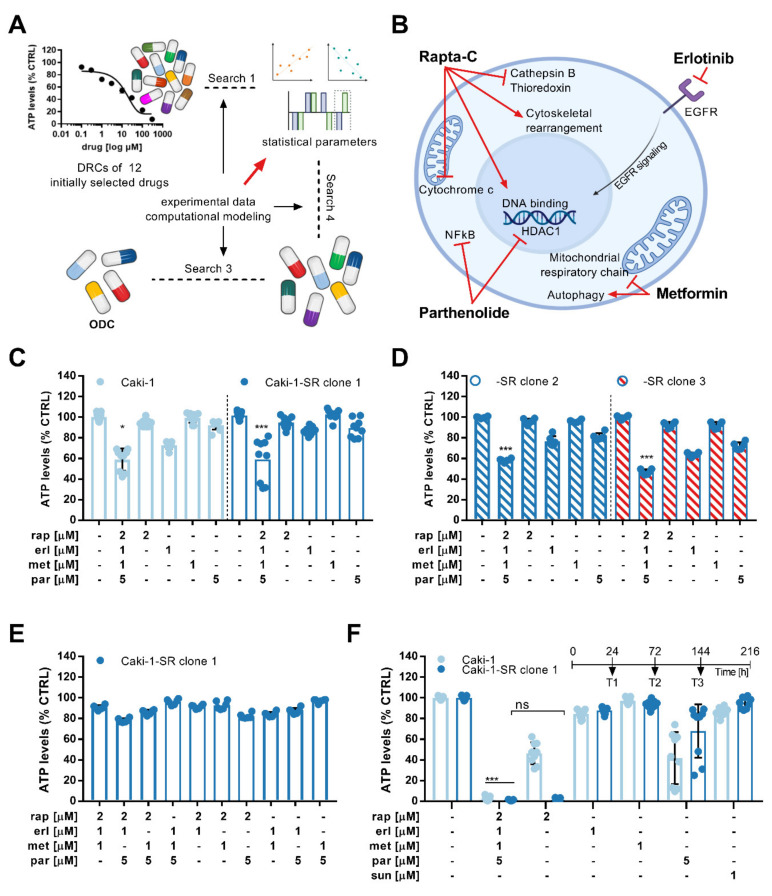
Figure 1.
Optimization of a multidrug combination and its activity in 2D cell cultures. (A) Schematic representation of the Therapeutically Guided Multidrug Optimization method to screen for multidrug combinations. An initial set of 12 drugs was selected and drug-response curves (DRCs) were generated to visualize the single-drug effects. In three searches, experimental and computational modeling were used to generate data facilitating the calculation of statistical parameters which are needed to guide drug inclusion and exclusion between the searches. Following this iterative process, a four-drug combination was designed and optimized (ODC). (B) This ODC contains Rapta-C, erlotinib, metformin and parthenolide (ODCREMP). The known targets for ODCREMP drugs are presented in the schematic of a cancer cell. (C) Bar graphs demonstrating the ATP levels (viability measure) of Caki-1 and Caki-1-SR clone 1 cells in response to the drug combination and monotherapy treatment. The error is presented as the standard deviation. Significance was calculated for N = 3 independent experiments using a one-way ANOVA test; * p < 0.05, *** p < 0.001. (D) Measure of the ATP levels after ODCREMP and monotherapy treatment in two Caki-1-SR clones 2 and 3 established following different protocols to induce resistance to sunitinib. Clone 2 was established, maintaining the chronic treatment of 1 µM sunitinib for more than 30 weeks. Clone 3 demonstrated intrinsic resistance after one single treatment of 10 µM sunitinib. The error is presented as the standard deviation. Significance was calculated for N = 3 independent experiments using a one-way ANOVA test; *** p < 0.001. (E) Upon the removal of one or two drugs at the time from the combination, the anti-cancer efficacy decreased significantly. (F) Retreating Caki-1 and Caki-1-SR cells 3 times, each 72 h, (time line above the graph) reduced the ATP levels significantly to values <5% compared with the untreated control. The error is presented as the standard deviation. Significance was calculated for N = 3 independent experiments using a one-way ANOVA test; *** p < 0.001.

