Figure 4.
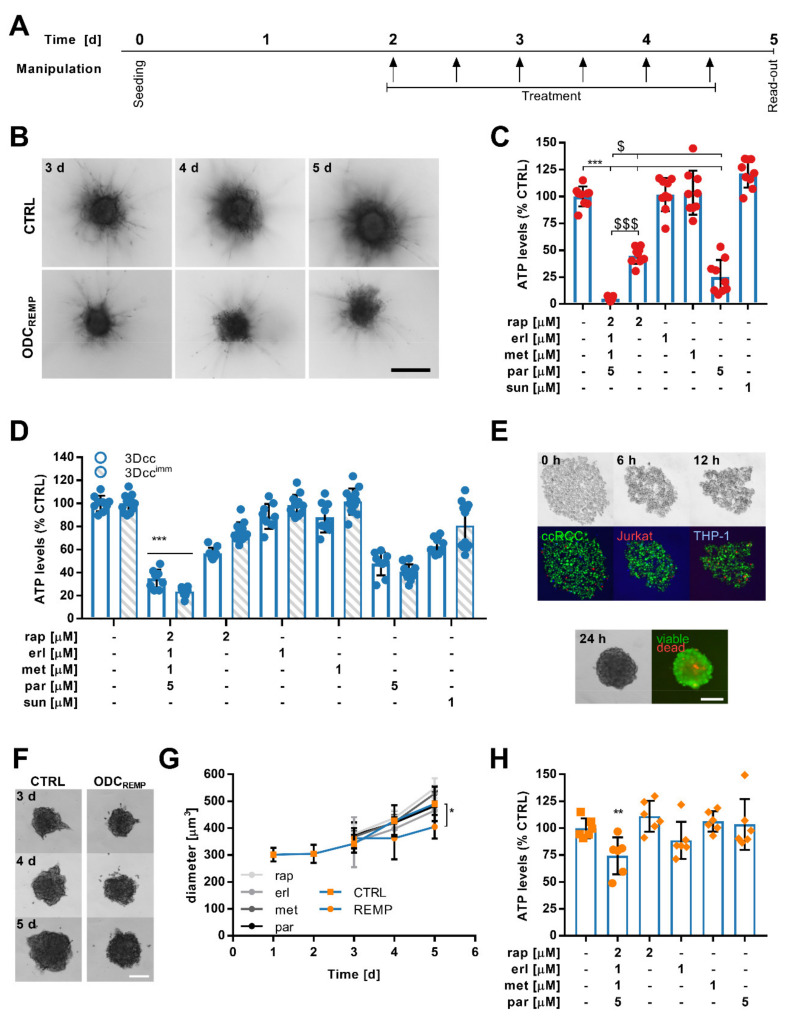
Activity of ODCREMP in in vitro and ex vivo organoid-like heterotypic 3D co-culture systems. (A) Timeline of the treatment schedule used for translation in heterotypic 3D co-cultures from cell lines and resected Caki-1-SR clone 1 tumors. (B) Caki-1-SR clone 1-based 3D co-cultures (3Dcc) were established in a collagen-rich (0.5 mg/mL collagen type 1) environment to induce a motile phenotype and sprout formation. After three days (3 d) sprouts were formed, which were monitored until 5 d. Representative bright-field images show the difference between untreated (CTRL) and ODCREMP-treated spheroids. The scale bar corresponds to 300 µm. (C) Bar graphs demonstrating the energy loss (reduction in ATP levels) of Caki-1-SR clone 1 3Dcc spheroids cultured in a collagen-rich environment in response to ODCREMP and monotherapy treatment. The error is presented as the standard deviation. Significance was calculated for N = 3 independent experiments using a one-way ANOVA test; * represents the comparison between all conditions, * p < 0.05, ** p < 0.01, *** p < 0.001. $ represents the comparison of the ODCREMP to single monotherapies only, $ p < 0.05, $$$ p < 0.001. (D) Comparison of the treatment response of Caki-1-SR clone 1-based 3Dcc and co-cultures including immune cell lines (3Dccimm). To obtain 3Dccimm spheroids, 5% Jurkat and 10% THP-1 cells were supplemented. The error is presented as the standard deviation. Significance was calculated for N = 3 independent experiments using a two-way ANOVA test; *** p < 0.001. (E) Representative bright-field and fluorescence images of the co-culture formation in times ranging from the moment of seeding (0 h) to 12 h. The cells were stained with CellTrackerTM dyes to monitor the movement during spheroid formation (green, ccRCC; red, Jurkat; and blue, THP-1). After 24 h, unstained spheroids were transferred from the culture well into a staining well including a solution of ethidium homodimer and calcein to visualize viable and dead areas in the spheroid (green, viable; red, dead). The scale bar corresponds to 200 µm. (F) Representative bright-field images of ex vivo organoid-like cultures derived from murine tumor tissue on day 3–5 (3–5 d) after seeding. Organoid-like cultures remained untreated (CTRL) or were exposed to ODCREMP treatment following the schedule depicted in A. The scale bar corresponds to 200 µm. (G) Measurement of the diameter of ex vivo organoid-like cultured derived from murine tumor tissue. Significance was calculated for n = 6 independent organoid-like cultures using a one-way ANOVA test; * p < 0.05. (H) ATP levels of ex vivo organoid-like culture responses after repeated ODCREMP and monotherapy treatment. The error is presented as the standard deviation. Significance was calculated for n = 6 independent organoid-like cultures using a one-way ANOVA test; ** p < 0.01.

