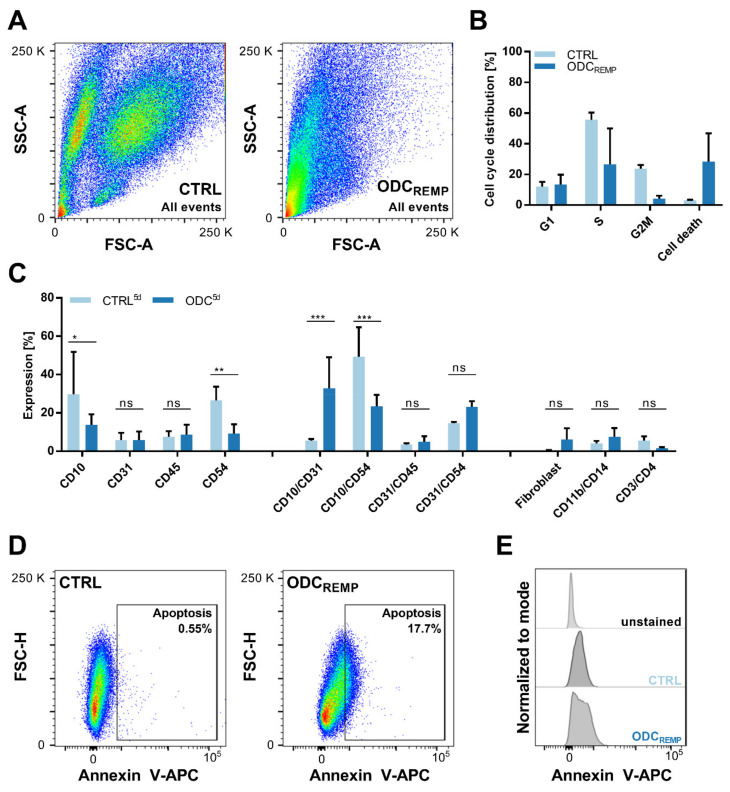
Figure 5.
Flow cytometry analysis to define the selectivity of the ODCREMP and its activity to arrest cell cycle progression. (A) Pseudocolor blots demonstrating the difference in the size and granularity (forward- and side-scatter signal; FSC and SSC, respectively) of 300 untreated (CTRL) and ODCREMP-treated 3Dccimm spheroids after dissociation into single-cell suspensions. (B) Propidium iodide staining was performed to detect the distribution of cells in the different stages of the mitotic cell cycle. (C) Expression of cell surface proteins shown through FACS analysis. The expression profile was captured after four and six repeated treatment administrations on day 5 (5 d) in comparison to the CTRL. Single and double protein expressions have been analyzed in comparison to cell surface proteins exclusively expressed on immune cells. The error is presented as the standard deviation. Significance was calculated for N = 3 independent experiments using a two-way ANOVA test; * p < 0.05, ** p < 0.01, *** p < 0.001. (D) Measurement of apoptosis through Annexin V staining demonstrating the increase in apoptotic cells after ODCREMP treatment. (E) Comparison of the unstained control versus the untreated and ODCREMP-treated 3Dccimm spheroids shown in histograms.

