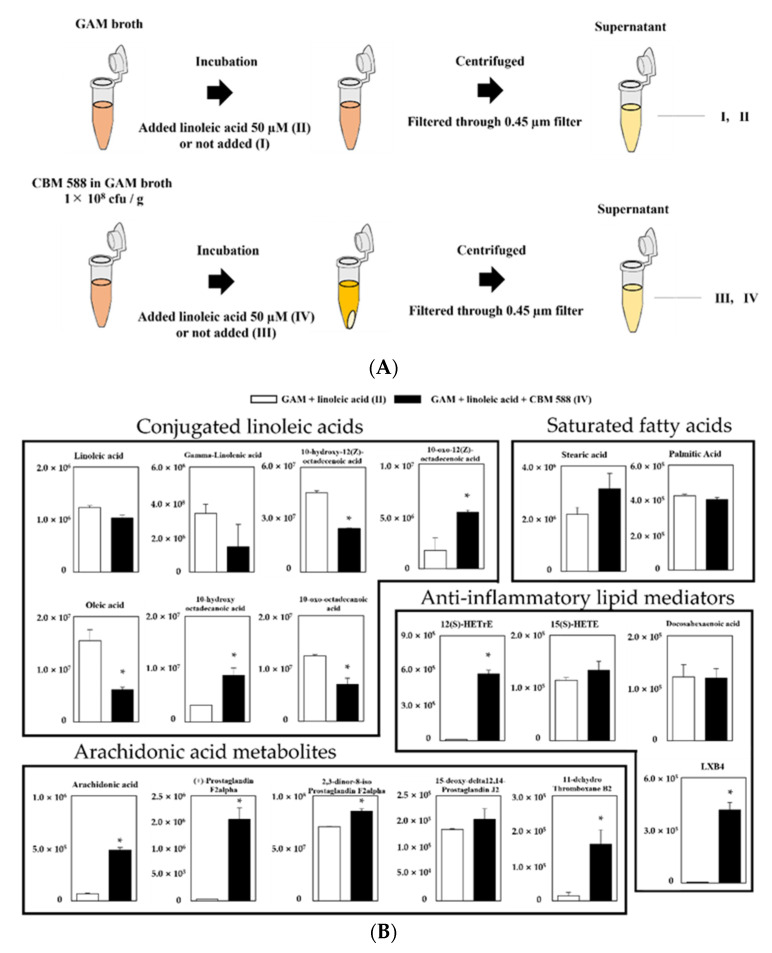
Figure 4.
Evaluation of linoleic acid conversion during CBM 588 single-culture test based on target fatty acid metabolites profiles. (A) Experimental design of CBM 588 culturing. Culture broth were divided into four groups as follows, I: GAM broth, II: GAM-broth-containing linoleic acid 50 µM, III: supernatant after 24 h CBM 588 culture in GAM broth and IV: supernatant after 24 h CBM 588 culture in GAM-broth-containing linoleic acid 50 µM. (B) The metabolic pathway for the PUFAs in GAM broth culture medium (II and IV). The signal intensities of the metabolites were compared using the average value of each group. The vertical axis indicates the signal intensity. The values represent the mean ± SD (n = 5). A probability was considered statistically significant at p < 0.05. *: p < 0.05 when compared with control.

