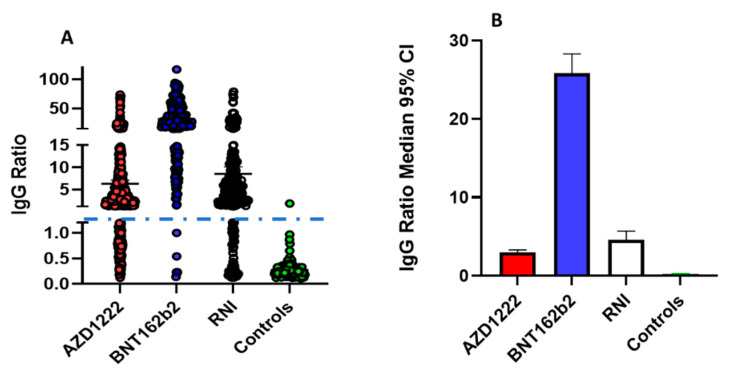
Figure 1.
Panel (A) dot plot of the four groups analysed: Red dots IgG ratio for AZD1222 vaccinated donors, blue dots for BNT162b2 vaccinated donors, white RNI donors, and green dots controls subjects. Blue dashed line shows the positivity cut-off ratio. Panel (B) shows the median and 95% CI of IgG ratio for the groups in the study with the same colour code of panel (A).

