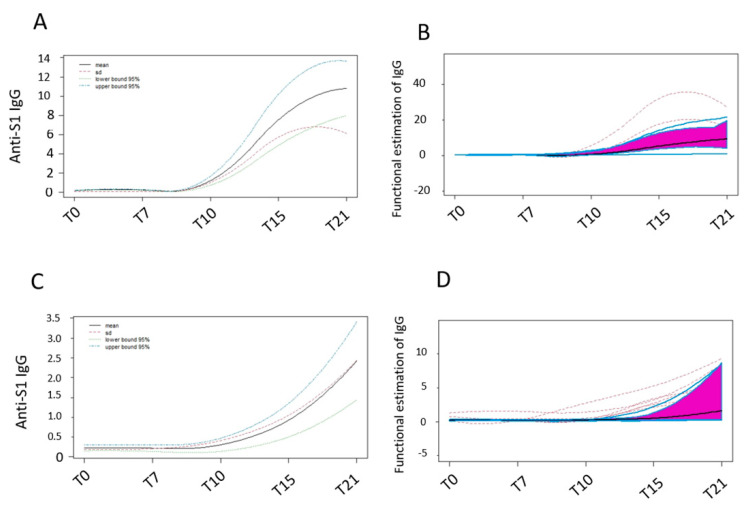
Figure 2.
Panel (A,C) show the mean level after the first dose administration (black line) of vaccines and the standard deviation between the IgG level (represented by the dashed red line) in BNT162b2 and AZD1222 vaccine, respectively. Panel (B,D) show the functional boxplot for BNT162b2 and AZD1222 IgG levels, respectively. The purple areas highlight the amplitude of 50% of the most central observation while the two outer blue curves correspond to the maximum and minimum curve of the dataset.

