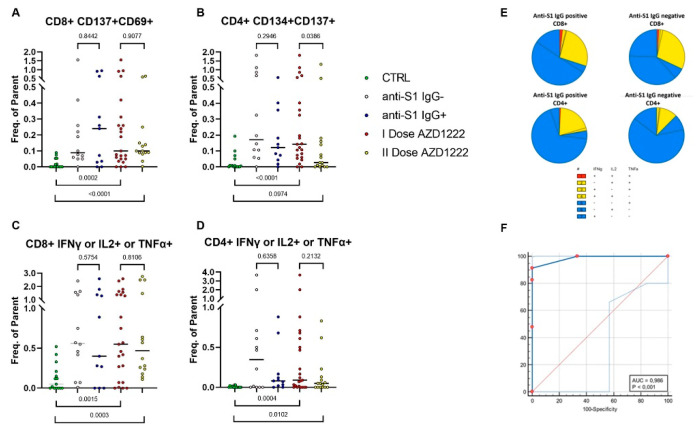
Figure 5.
SARS-CoV-2-specific T cells in anti-S1 IgG seronegative and seropositive AZD1222 vaccinated donors. Frequencies of CD8+ or CD4+ T cells expressing T-cell activation markers (A,B) and producing antigen-specific cytokines (C,D) are shown in SARS-CoV-2 unexposed healthy donors who never received any anti-SARS-CoV-2 vaccine (CTRL), in anti-S1 IgG seronegative (anti-S1 IgG-) and seropositive (anti-S1 IgG+) donors vaccinated with a single dose of AZD1222, in the whole cohort of donors after a single dose of the AZD1222 vaccine administration (I dose AZD1222) and in a group of AZD1222 fully vaccinated donors. Frequencies were obtained by subtracting to the values of the stimulated samples the background produced by the related unstimulated tube. Individual data points are represented as scatter dot plots with lines showing the median value. Significance was calculated using non-parametric Mann–Whitney U-tests (two-tailed). (E) Pie charts show the expression of cytokine combinations from CD4+ and CD8+ T cells anti-S1 IgG seronegative and seropositive donors vaccinated with a single dose of AZD1222. (F) The ROC curve represents the performance of flow cytometry analysis.

