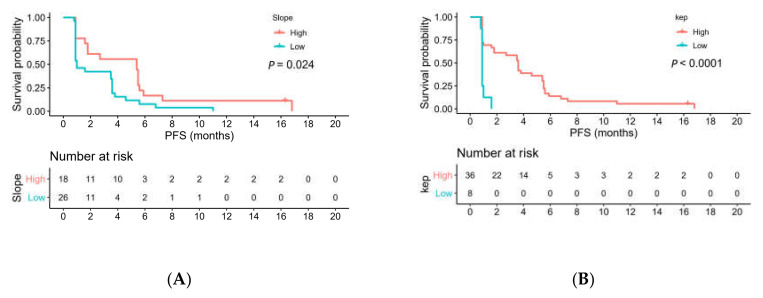
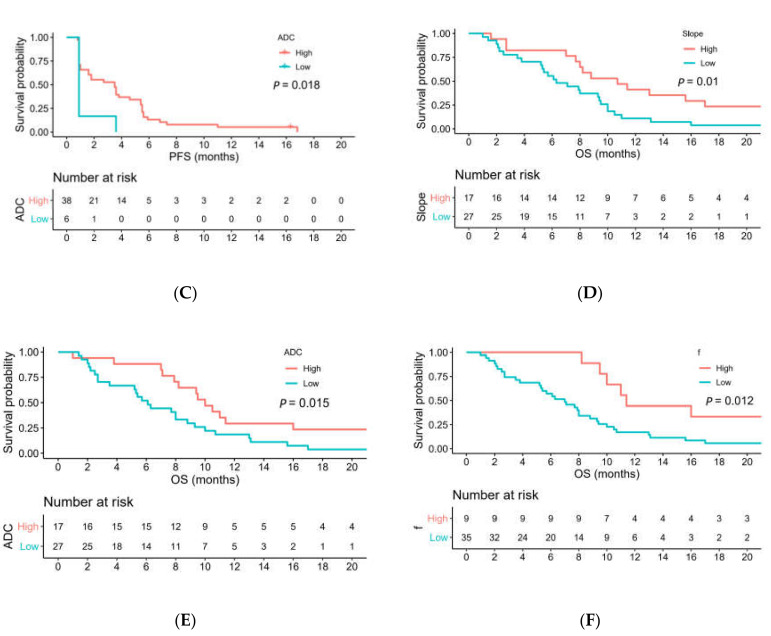
Figure 5.
Kaplan–Meier curves indicating that participants with high pretreatment (A) slope, (B) Kep, and (C) ADC values had longer PFS than those with low values did. High pretreatment (D) slope, (E) ADC, and (F) f values had a longer OS than those with low values did. Cutoffs for MRI biomarkers were determined by using maximally selected rank statistics (maxstat package) in R statistical software.


