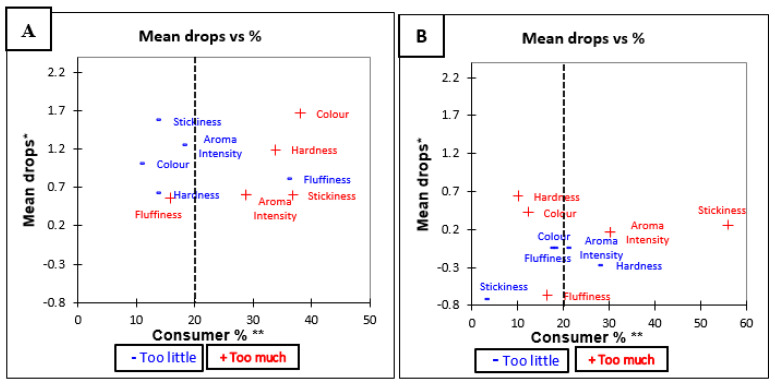
Figure 2.
Mean drop plots for Jasmine rice variety before tasting (A) Jasmine Brown, and (B) Jasmine White. * Mean drop is the decrease in liking compared to the mean liking of those who rated the attribute as JAR. ** Consumer % are the consumers which judged an attribute as not ideal (Just About Right). The attributes with large percentages of consumers and penalties are in top right quadrant of the plot, which illustrates the critical points of the product [34].

