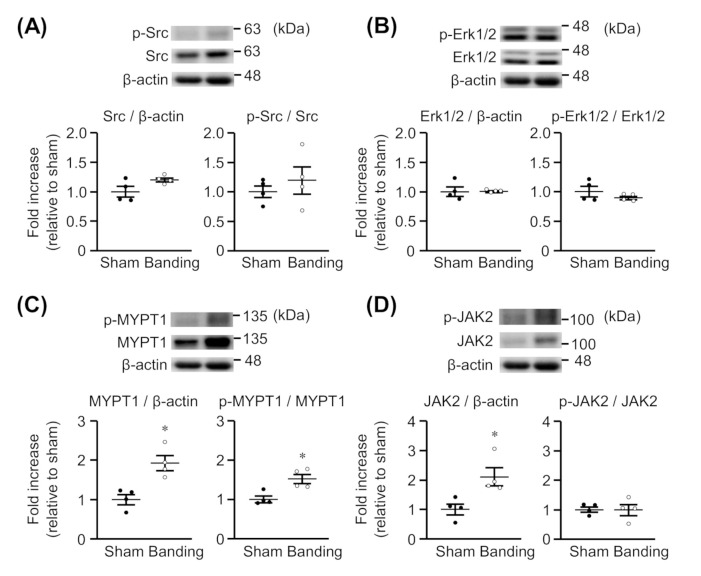
Figure 2.
Expression of total and phosphorylated Src (A), Erk1/2 (B), MYPT1 (C), and JAK2 (D) in thoracic aortas from sham-operated (Sham) or pressure-overloaded (Banding) rats. Upper: representative blots. Lower: scatter plots demonstrating densitometric quantification of the ratios of total or phosphorylated proteins to the corresponding β-actin or total proteins, respectively. Results are shown as the fold increase relative to Sham. Data are means ± S.E.M. of four independent experiments, * p < 0.05 vs. Sham.

