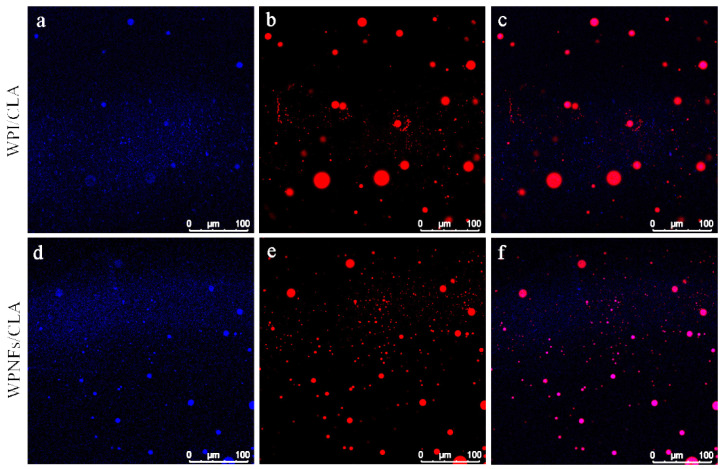
Figure 5.
Confocal laser scanning microscope images of different samples (scale bar: 100 μm). (a) Whey protein isolate (WPI) and (d) WPNFs in emulsions, (b,e) conjugated linoleic acid (CLA) in emulsions, (c,f) overlap of fluorescence field of emulsions. WPI and WPNFs stained with Thioflavine T, blue at 408 nm and CLA stained with Nile red, red at 488 nm.

