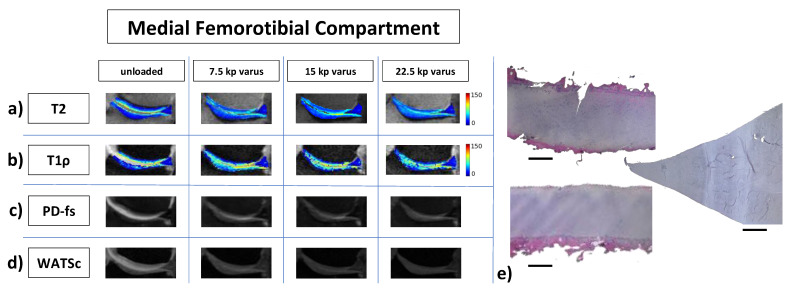
Figure 2.
Representative multiparametric MR images of the medial femorotibial compartment in response to varus loading and corresponding histologic sections. (a–d) Displayed are T2 maps (a), T1ρ maps (b), and morphologic images, i.e., proton density-weighted fat-saturated (PD-fs, (c)) and water selective cartilage scan images (WATSc, (d)) as a function of increasing varus loading intensity. Segmentation outlines were overlaid onto the corresponding morphologic images and pixel intensities were color-coded (ms). MR images were cropped and zoomed to the areas of interest. (e) Corresponding histologic sections of the tibial cartilage (e1), the femoral cartilage (e2), and medial meniscus (e3) after hematoxylin-eosin staining. Bars indicate 1 mm. Same right knee joint as in Figure 1 and Figure 3.

