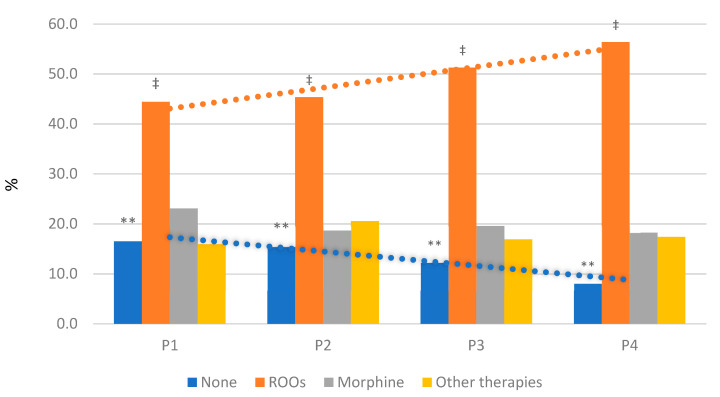
Figure 5.
Distribution of therapies according to phenotypes. The NP-BTcP management differs between phenotypes. Orange trend indicates significant increase of ROOs from P1 to P4 (‡ p = 0.008); blue trend shows significant decrease of none therapy from P1 to P4 (** p = 0.003). Abbreviations: NP-BTcP—non-predictable breakthrough cancer pain; ROOs—rapid-onset opioids.

