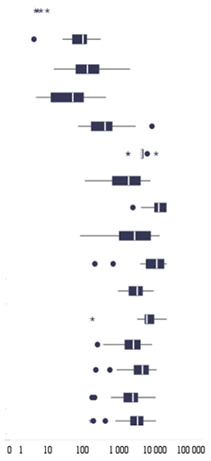
Table 2.
Median, maximum, and minimum concentrations of anti-SARS-CoV-2 IgG antibodies in the compared subgroups.
| COVID-19 and/or Vaccination Status | IgG_concentration (BAU/mL) | ||||
| Mean | Median | Minimum | Maximum |

|
|
| uninfected, unvaccinated | 3.57 | 3.20 | 3.20 | 8.56 | |
| asymptomatic SARS-recovered. unvaccinated | 112.59 | 94.95 | 3.20 | 296.40 | |
| symptomatic SARS-recovered. unvaccinated | 236.52 | 124.33 | 13.63 | 1,920.00 | |
| 2 weeks after the first vaccine dose. uninfected | 91.36 | 46.99 | 3.55 | 404.45 | |
| 3 weeks after the first vaccine dose.uninfected | 1,209.40 | 384.00 | 67.62 | 7,680.00 | |
| 3 weeks after the first vaccine dose. SARS-recovered | 4,397.00 | 3,989.00 | 1,666.00 | 10,068.00 | |
| 1 week after the second vaccine dose. uninfected | 2,228.53 | 1,747.20 | 106.02 | 7,045.00 | |
| 1 week after the second vaccine dose. SARS-recovered | 11,940.33 | 11,973.25 | 2,280.30 | 19,200.00 | |
| 2 weeks after the second vaccine dose. uninfected | 4,261.08 | 2,563.20 | 78.00 | 12,650.50 | |
| 2 weeks after the second vaccine dose. SARS-recovered | 10,241.42 | 10,375.75 | 198.70 | 19,638.00 | |
| 3 weeks after the second vaccine dose. uninfected | 3,327.63 | 3,039.60 | 880.00 | 8,677.00 | |
| 3 weeks after the second vaccine dose. SARS-recovered | 7,442.47 | 5,516.00 | 168.50 | 19,865.00 | |
| 4 weeks after the second vaccine dose. uninfected | 2,658.50 | 2,379.50 | 235.50 | 7,805.00 | |
| 4 weeks after the second vaccine dose. SARS-recovered | 4,490.81 | 4,196.50 | 210.50 | 10,391.50 | |
| 5 weeks after the second vaccine dose. uninfected | 2,474.46 | 2,294.50 | 166.00 | 9,836.50 | |
| 5 weeks after the second vaccine dose. SARS-recovered | 3,190.51 | 3,096.25 | 160.00 | 10,135.50 | |
