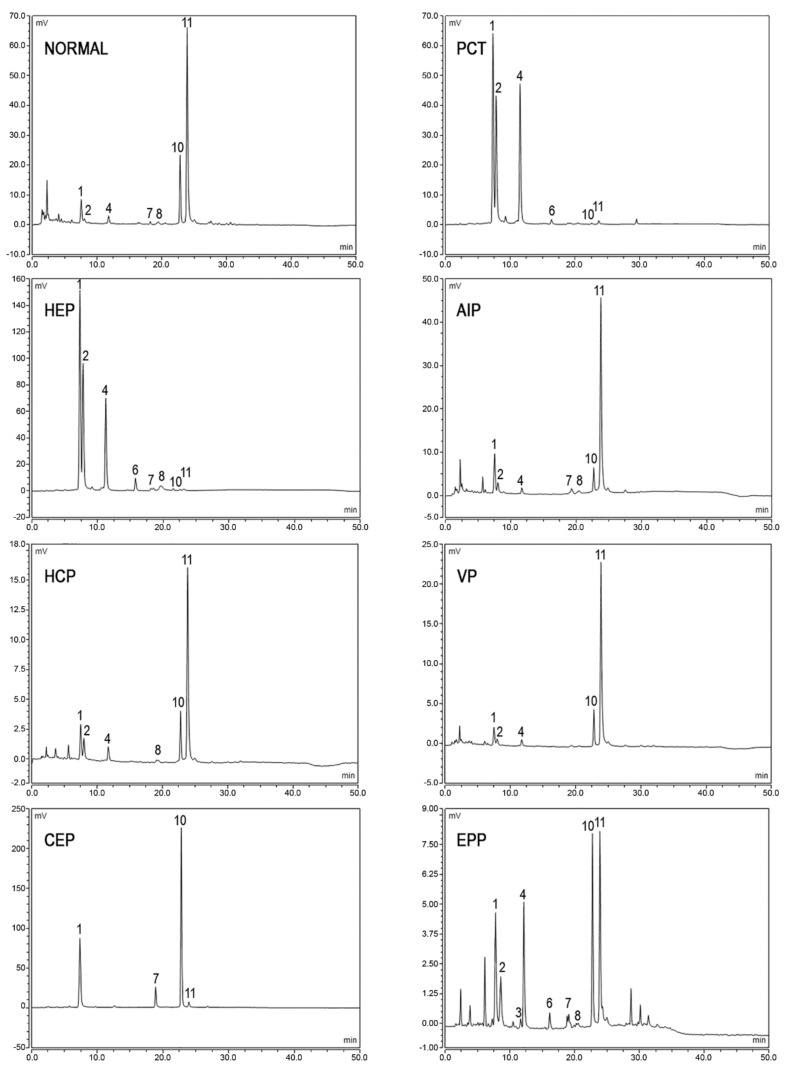
Figure 3.
Chromatographic profiles of urine porphyrins. The figure shows the patterns of excretion of healthy individuals (NORMAL) and patients (PCT, HEP, AIP, HCP, VP, CEP, EPP). Fluorescence peaks are identified as uroporphyrin I (1), uroporphyrin III (2), heptacarboxylic acid porphyrin I (3), heptacarboxylic acid porphyrin III (4), hexacarboxylic acid porphyrin III (6), pentacarboxylic acid porphyrin I (7), pentacarboxylic acid porphyrin III (8), coproporphyrin I (10), coproporphyrin III (11).

