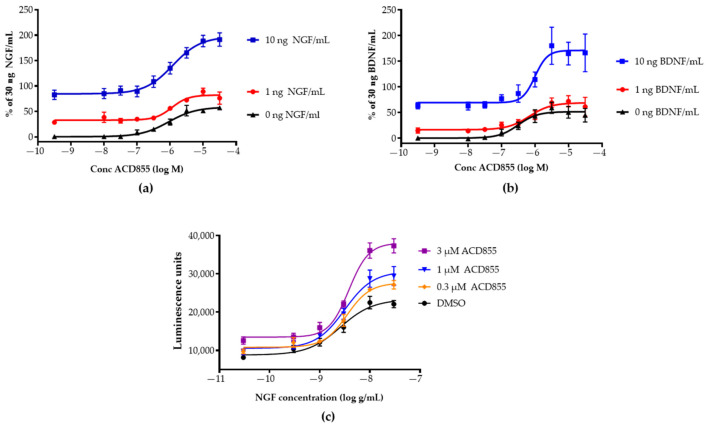
Figure 2.
In vitro effects of ACD855 on NGF- or BDNF-signaling. U2OS cells expressing TrkA or TrkB were used to determine the effects of ACD855 at different concentrations of NGF or BDNF or to determine the effects of ACD855 on the dose–response curve of NGF. U2OS-TrkA (a) or U2OS-TrkB (b) cells (5000 cells per well) were incubated with an increasing amount of ACD855 and a fixed concentration of NGF (a) or BDNF (b), as indicated (0 ng/mL (black lines and triangles), 1 ng/mL (red lines and circles), or 10 ng/mL (blue lines and squares). 100% was defined as the activity obtained with 30 ng NGF/mL. (c) U2OS-TrkA cells were incubated with DMSO or with 0.3, 1, or 3 µM of ACD855, as indicated in the absence or presence of increasing amounts of NGF to achieve complete dose–response curves of NGF. Luminescence units were the total amount of luminescence obtained at all wavelengths from each well. The amount of luminescence was a direct measurement of the amount of SHC-1 interacting with the phosphorylated tyrosine residue 490 of the TrkA and thus an indirect measurement of receptor activation.

