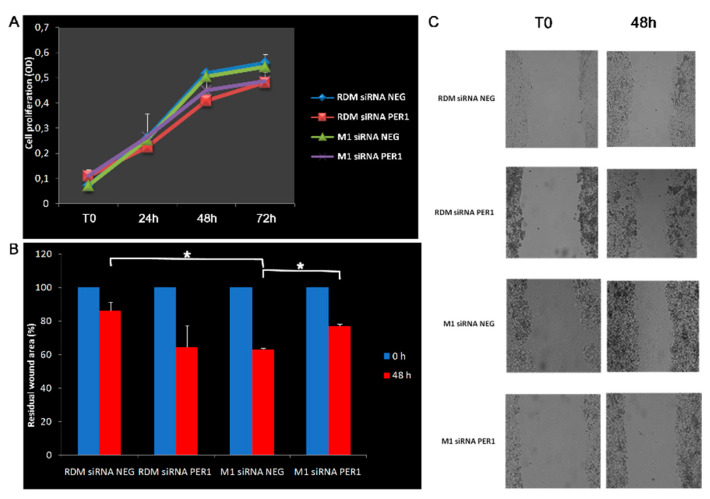
Figure 3.
Evaluation of proliferative and migratory capacity: (A) cell proliferation curves; (B) wound area relative to closure (%) assessed at 48 h. Artificial wounds were made in confluent monolayers of control and macroH2A1 KO with or without PER1-silencing cells. Cell migration towards the wound, photographed from 0 h to 48 h. (C) Representative microphotographs of the residual wound area. Original magnification 10X. Cell migration was determined by the rate of scratched area closure over time using ImageJ™ software. See the Materials and Methods section for more details. RDM siRNA NEG = siRNA scramble-treated HepG2 cells; RDM siRNA PER1 = siRNA PER1-treated HepG2 cells; M1 siRNAneg = siRNA scramble-treated macroH2A1 knocked down HepG2 cells; M1 siRNA PER1 = siRNA PER1-treated macroH2A1 knocked down HepG2 cells; bars, standard error of mean (SEM); * p < 0.05; three biological replicates were each assayed in triplicate and results were expressed as mean ± standard error of mean (SEM).

