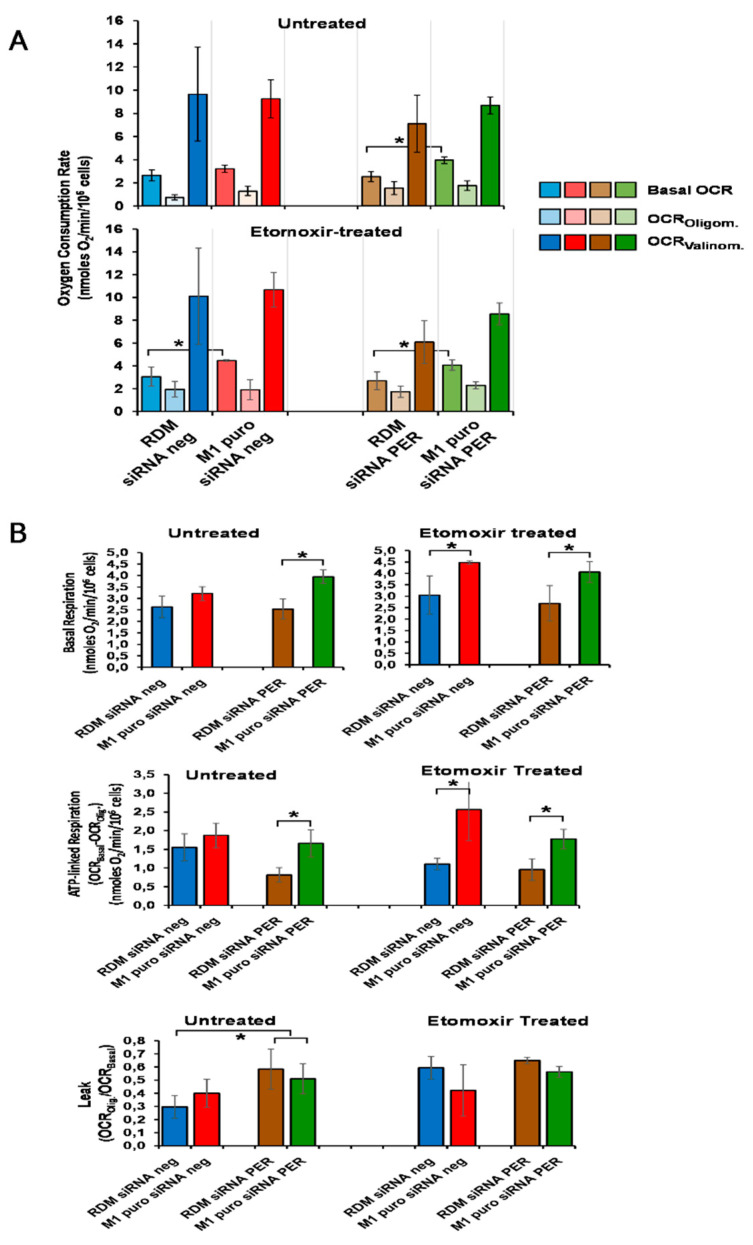
Figure 7.
Effect of macroH2A1 and PER1 modulation on mitochondrial respiratory activity in HepG2 cells. Intact cells were assessed by high-resolution oximetry. (A) Oxygen consumption rates (OCR) outcomes. The upper and lower panel refer to OCRs measured in the absence and in the presence of etomoxir, respectively. The colored bars refer, with different tones, to basal OCR and following the addition of oligomycin and valinomycin (see legend). The values are corrected for mitochondria-unrelated respiration (expressed as nmoles O2/min/106 cells). (B) Mitochondrial respiration-linked bioenergetics parameters inferred from the results in (A). Upper bipartite panels: basal respiration on an enlarged scale; middle panel: ATP-linked respiration attained subtracting from the basal OCRs the OCROligom; lower panels: normalized respiratory leak attained as the OCROligom/OCRBasal ratio. See the Materials and Methods section for more details. RDM siRNA NEG = siRNA scramble-treated HepG2 cells; RDM siRNA PER1 = siRNA PER1-treated HepG2 cells; M1 siRNA NEG = siRNA scramble-treated macroH2A1 knocked down HepG2 cells; M1 siRNA PER1 = siRNA PER1-treated macroH2A1 knocked down HepG2 cells; bars, standard error of mean (SEM); * p < 0.05; three biological replicates were each assayed in triplicate and results were expressed as mean ± standard error of mean (SEM).

