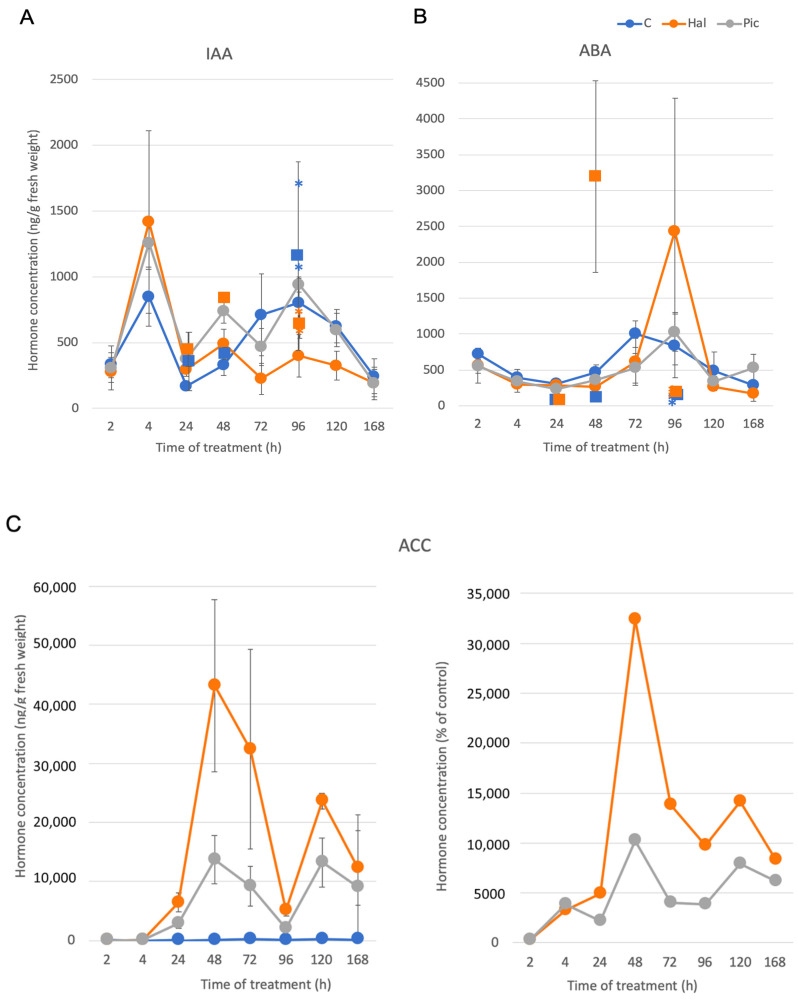
Figure 5.
Time course of IAA (A), ABA (B), and ACC (C) between 2 and 168 h after treating plants with control solution and solutions containing Hal and Pic. Additional individual data points for Hal treatment (squares) in the time course were from additional experiments performed at different years. Please note the differences in the scale of the y-axis. Data are means of three biological and two to three technical experiments. The squares + SE are from a separate experimental set of plants grown at a different time point and not shown in any other figure; the blue and orange asterisks indicate the values for that time point shown in Figure 3A,B. The second panel in Figure 5C indicates the percentage of ACC after treatment compared to controls.

