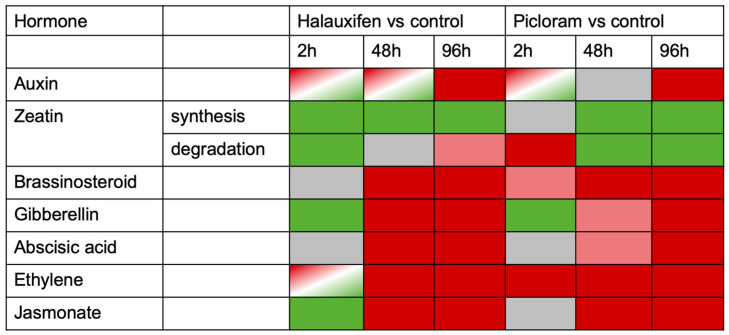
Figure 8.
Differentially regulated KEGG pathways for Hal and Pic treatments after 2, 48, and 96 h compared to controls with respect to genes encoding hormonal biosynthetic pathways. Summary of regulation drawn as a heat map. Green = majority of genes downregulated; red/light red = majority of genes upregulated; red/green = some genes upregulated and some downregulated in the same pathway; gray = no regulation of any gene from one pathway. The complete pathways are shown as KEGG representations in Figure S6.

