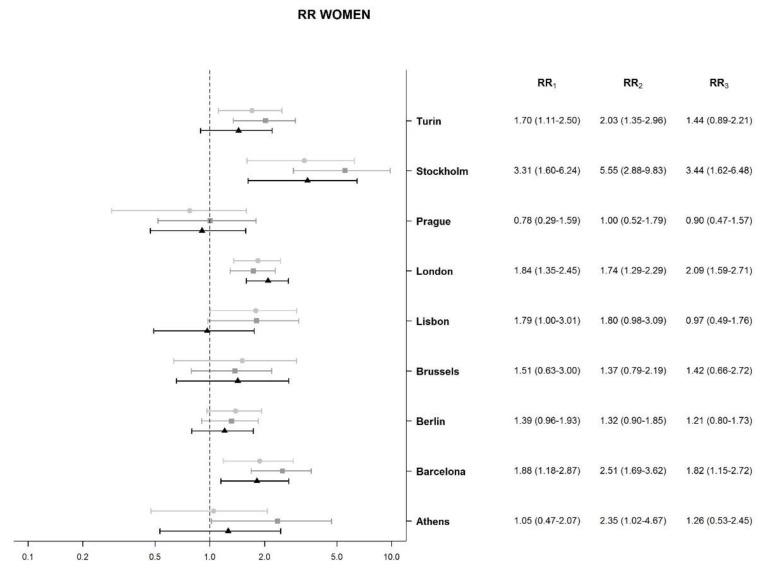
Figure 2.
Association between socioeconomic deprivation index and liver cirrhosis mortality, relative risk (RR), and 95% credible intervals (CI) for women in nine urban areas. Notes: RR compares liver cirrhosis mortality of the 95th percentile value of socioeconomic deprivation (severe deprivation) to the 5th percentile value (low deprivation). RR1: RR in the first period (2000–2003); RR2: RR in the second period (2004–2008); RR3: RR in the third period (2009–2014).

