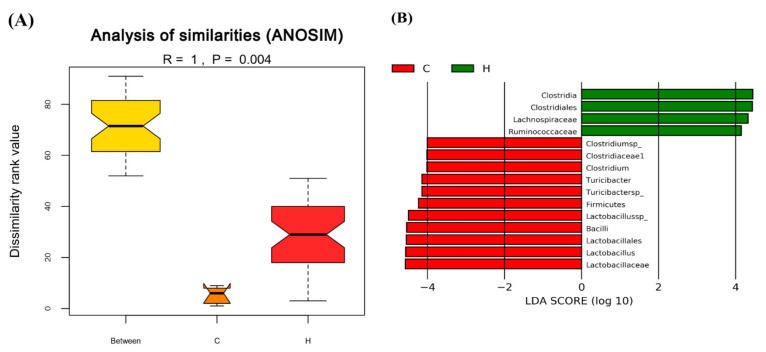
Figure 7.
Statistical analysis and biomarkers of gut microbiota in control and high-fat/sucrose diet-fed mice after 14 weeks of induction. (A) Analysis of similarities (ANOSIM) method was used to determine the significance of differences in the species composition and community results of the grouped samples. Results based on Bray–Curtis dissimilarities (p = 0.004). (B) Linear discriminant analysis Effect Size (LEfSe) was used to estimate the magnitude of the impact of each species abundance on the difference effect, and find the communities or species that have significant differences in the sample division. The Linear discriminant analysis (LDA) distribution histogram shows the species as biomarkers whose LDA Score is greater than the threshold setting value (default: 4) with statistical differences between groups. The length of the histogram represents the impact of different species. Results based on taxonomy data.

