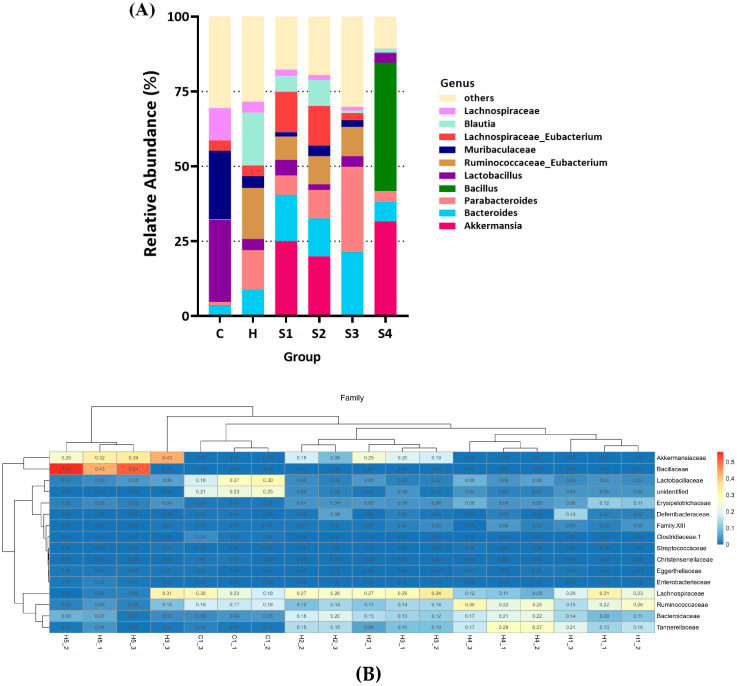
Figure 10.
Taxa analysis of gut microbiota composition in mice. (A) Relative abundance bar chart. Top 10 classification for genus level for each group are shown. Taxa not in the top 10 are grouped together in the ‘others’ category. (B) Hierarchical clustering heatmap with dendrograms. Interactive hierarchical clustering heatmap represents relative abundance of taxa on a color gradient. The top 40 most abundant family taxa are shown.

