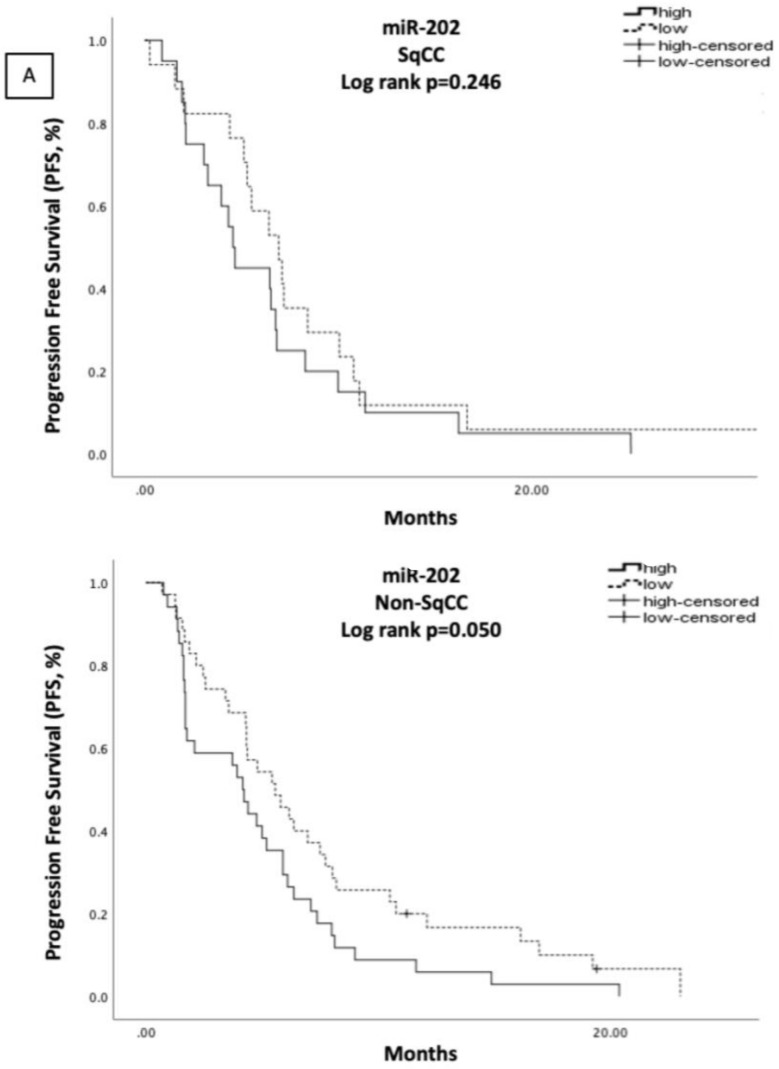
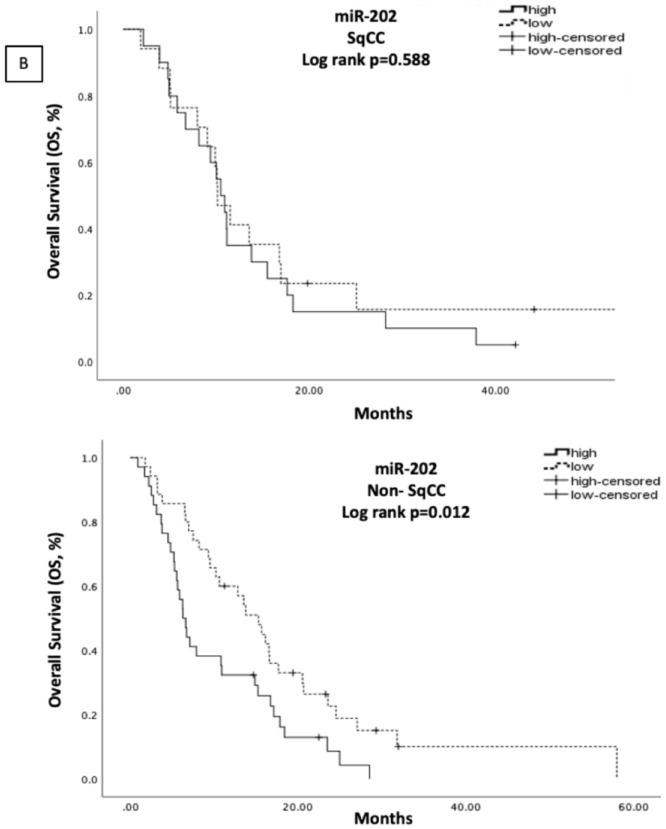
Figure 4.
Kaplan–Meier analysis for PFS (A) and OS (B) according to miR-202 expression levels in the plasma of SqCC (N = 40) and non-SqCC (N = 85) NSCLC patients. Median expression values classified patients into high and low expression groups. Curves were compared using the log rank test. p values are shown.


