Figure 3.
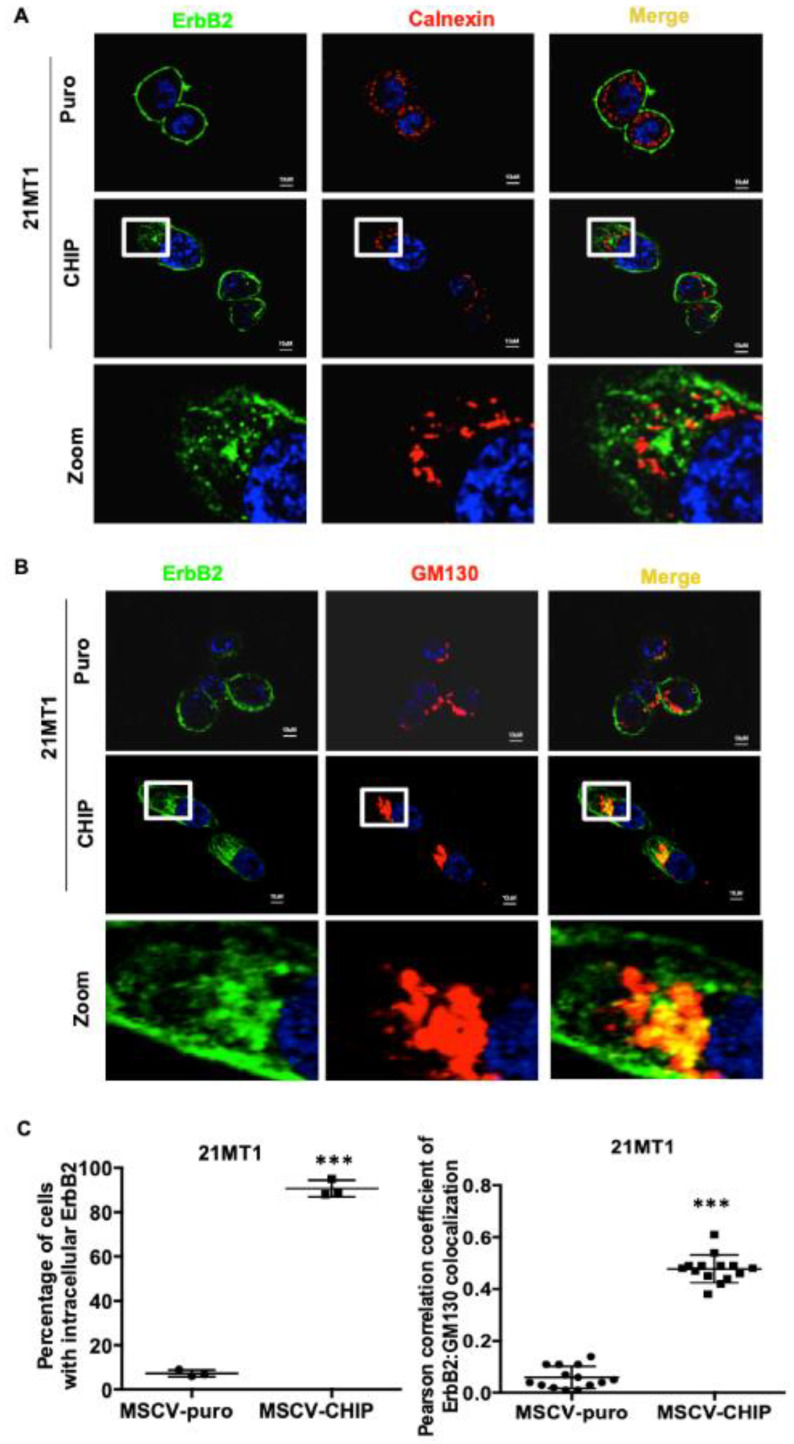
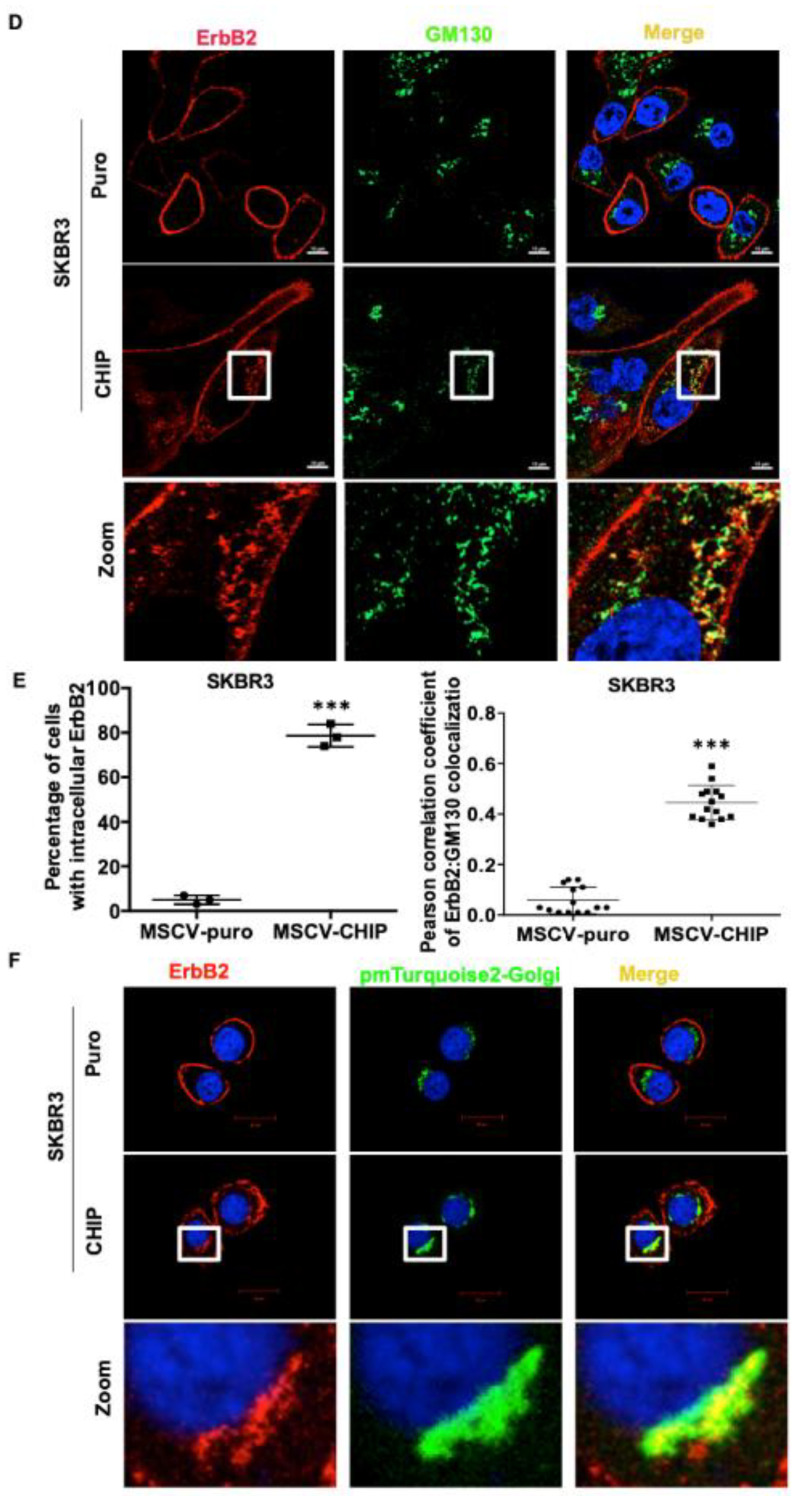
CHIP overexpression leads to increased ErbB2 retention in the Golgi. (A) 21MT1-puro and 21MT1-CHIP cell lines were seeded on glass coverslips for 48 h. Cells were fixed and stained with anti-ErbB2 (green) and anti-calnexin (ER marker) (red) antibodies followed by staining with the corresponding fluorescent secondary conjugates. Coverslips were mounted with anti-fade containing DAPI and images were acquired under a Zeiss LSM 710 confocal microscope. (B) 21MT1-puro and 21MT1-CHIP cell lines were seeded on coverslips, fixed, and stained with anti-ErbB2 (green) and anti-GM130 (red) antibody followed by incubation with secondary fluorescent conjugate as in A. Zoom images of selected representative area are shown in (A,B). (C) Quantification of percentage of cells with intracellular ErbB2 staining in A and B (left panel) and Pearson’s Coefficient of Colocalization between ErbB2 and GM130 in (B). Data represent mean ± SD, n = 3, *** p < 0.001. Pearson correlation coefficient was analyzed using FIJI function of ImageJ. (D) SKBR3-puro and SKBR3-CHIP cell lines were seeded on coverslips, fixed, and stained with anti-ErbB2 (red) and anti-GM130 (green) antibodies, followed by the respective fluorescent secondary conjugates. Coverslips were mounted with anti-fade containing DAPI and images were acquired under a Zeiss LSM 710 confocal microscope. Zoom images of selected representative area are shown. (E) Quantification of percentage of cells with intracellular ErbB2 staining (left panel) and Pearson’s Coefficient of Colocalization between ErbB2 and GM130 presented in (D). Data represent mean ± SD, n = 3, *** p < 0.001. Pearson correlation coefficient was analyzed using FIJI function of ImageJ. (F) SKBR3-puro and SKBR3-CHIP cell lines were seeded on coverslips and transiently transfected with pmTurquoise2-Golgi vector (shown in green) as a marker of the Golgi apparatus. Cells were fixed and stained with anti-ErbB2 antibody followed by the fluorescent secondary conjugate (red). Coverslips were mounted with anti-fade containing DAPI and images were acquired under a Zeiss LSM 710 confocal microscope. Zoom images of selected representative area are shown.


