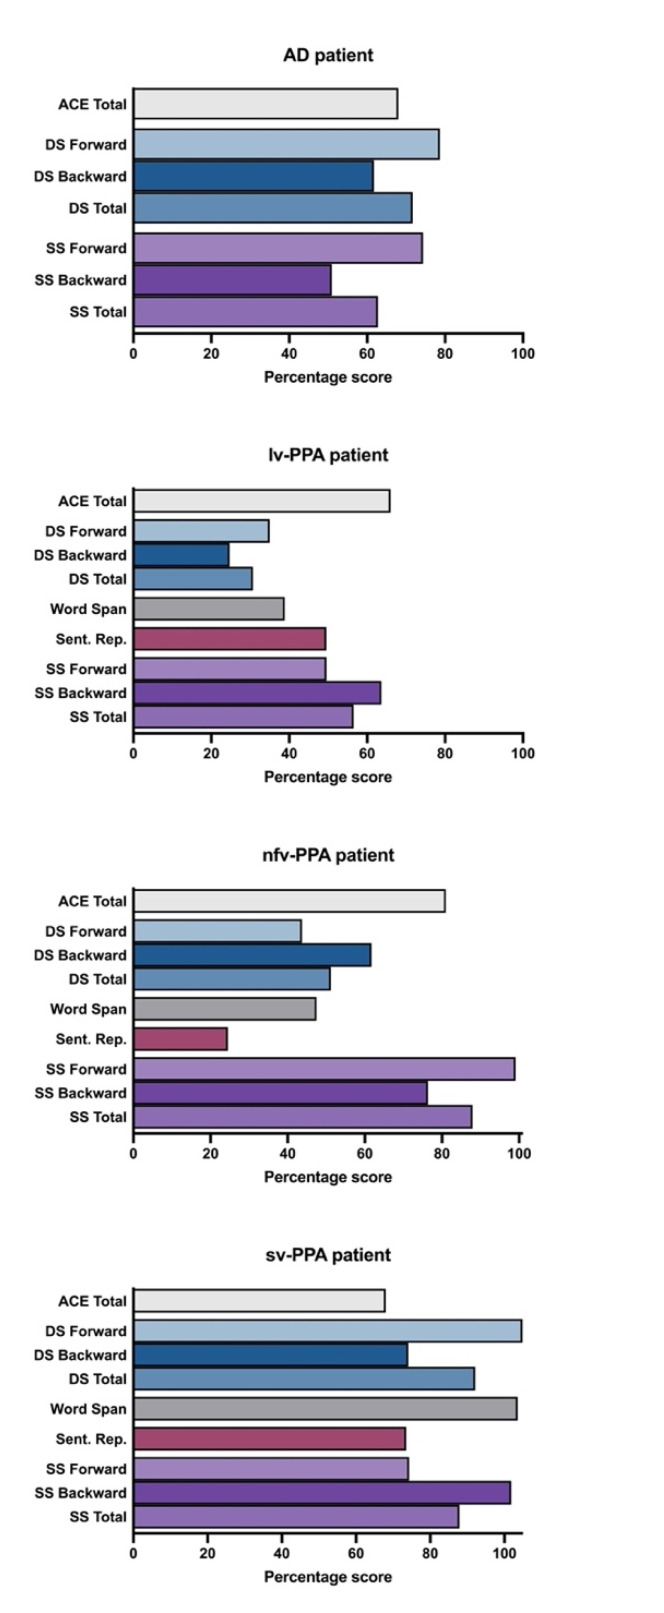
Figure 6.
Short-term and working memory performances represented as percentage scores of normal performance (i.e., the patient’s score divided by a control mean, times by 100). The ACE total bar charts are the patient’s raw score on this measure. Control means taken from Foxe, Irish [4]. Notes, ACE: Addenbrooke’s Cognitive Examination-III; DS: Digit Span; Sent. Rep: Sentence Repetition; SS: Spatial Span.

