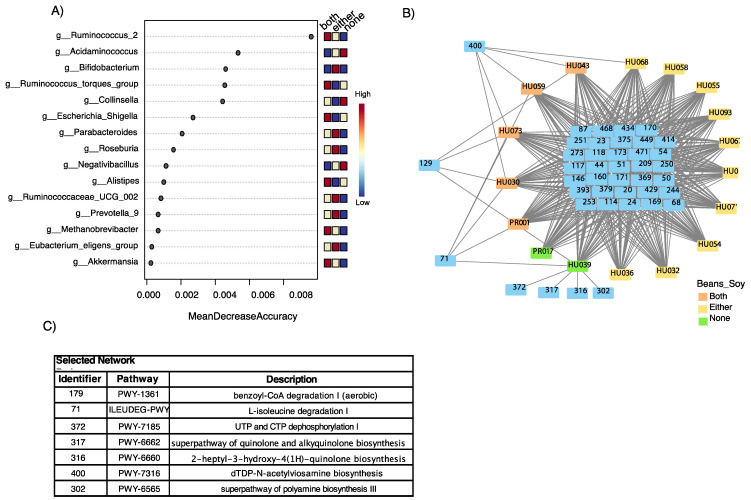
Figure 4.
Linear discriminant analysis effect size (LEFsE) of bacterial communities. LEfSe plot showing possible bacterial markers of consumption of both beans and soy Panel (A). Pathway network identifies similarities among soy and/or bean consumers in terms of the potential biochemical pathways of the microbiota. Panel (C). Table associating bacterial taxa to the pathways identified in the network in Panel (B).

