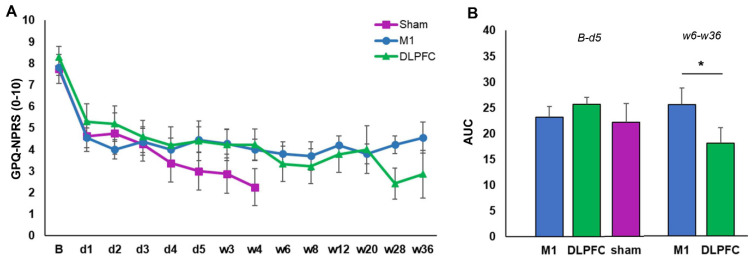
Figure 5.
rTMS effects on pain intensity. (A) Mean GPQ-NPRS across sessions and stimulation conditions. (B) The area under the curve (AUC) across stimulation conditions from baseline up to the 5th day of stimulation (left) and from the 6th week until the 36th of stimulation (right). B = baseline; d = day; w = week; GPQ-NPRS = German Pain Questionnaire-Numerical Pain Rating scale; M1 = primary motor cortex; DLPFC = dorsolateral prefrontal cortex; Error bars denote standard error of mean (SEM). The * symbol indicates significant group differences (p ≤ 0.05).

