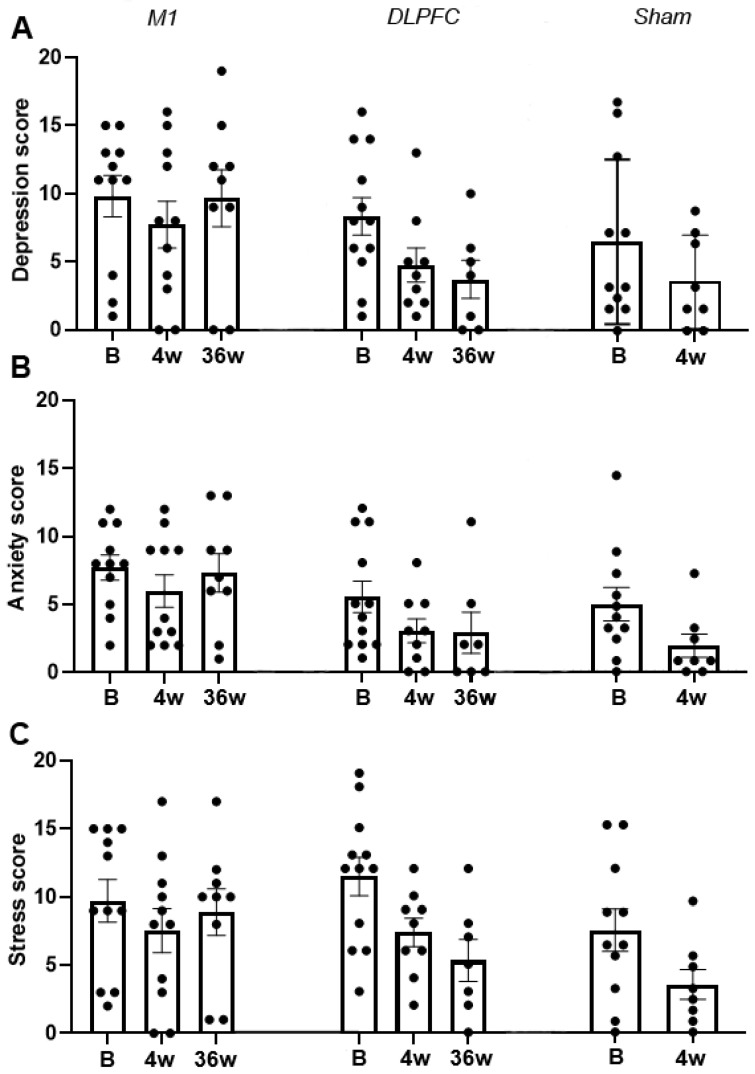
Figure 6.
rTMS effects on DASS score for depression (A), anxiety (B), and stress (C). The y-axis indicates the mean score, and the x-axis depicts the time points (in weeks) of conducted measurements. Each dot shows the individual patients’ score. B = baseline; w = week; M1 = primary motor cortex; DLPFC = dorsolateral prefrontal cortex; Error bars depict the standard error of mean (SEM).

