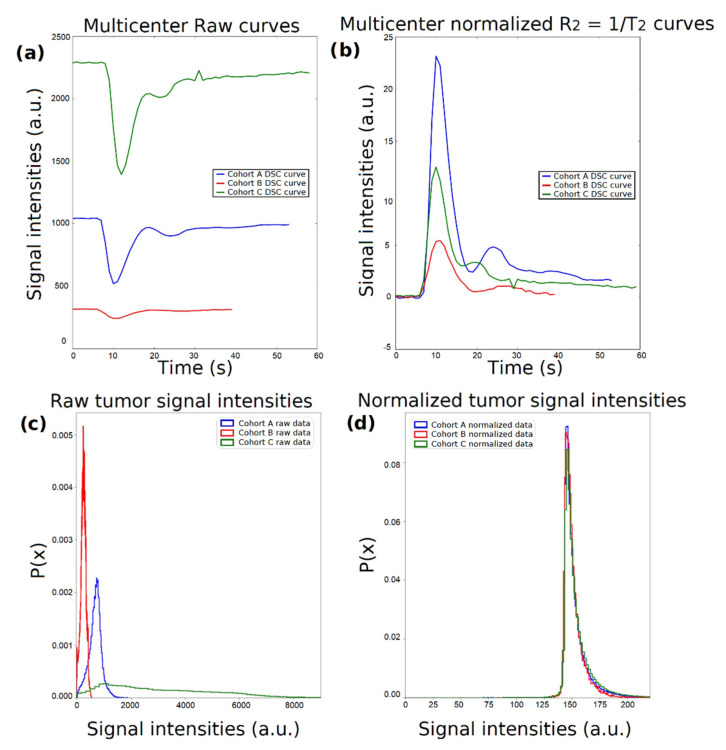
Figure 2.
Schematic representation of the normalization process. (a) Dynamic susceptibility contrast (DSC) perfusion curves from the 3 tertiary centers. (b) curves after normalization using equation (1). (c) Center-specific probability density functions of the raw signal intensities within the voxels of interest (VOIs) at time point T_max. (d) Center-specific probability density functions of the normalized signal intensities within the VOIs at time point T_max.

