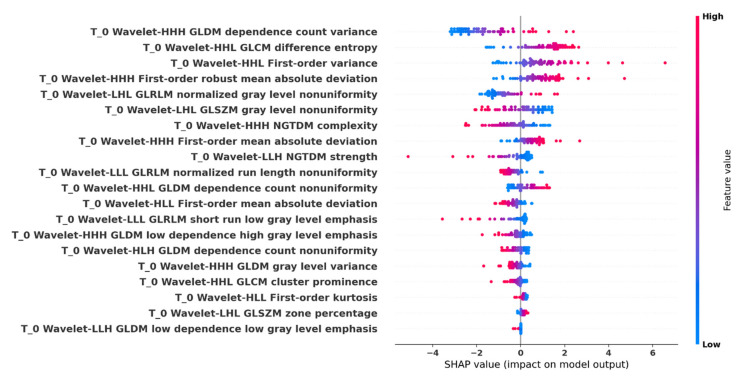
Figure 10.
Shapley additive explanations (SHAP) summary plot. All important radiomics feature values are displayed as dots using a pseudocoloring (blue to red), low or zero contributors are near a SHAP value of zero, a long distance from zero denotes a higher influence of a specific feature in the prediction performance, where decreased or increased values favored the negative (IDH-mutant) or positive (IDH-wildtype) classes, respectively.

