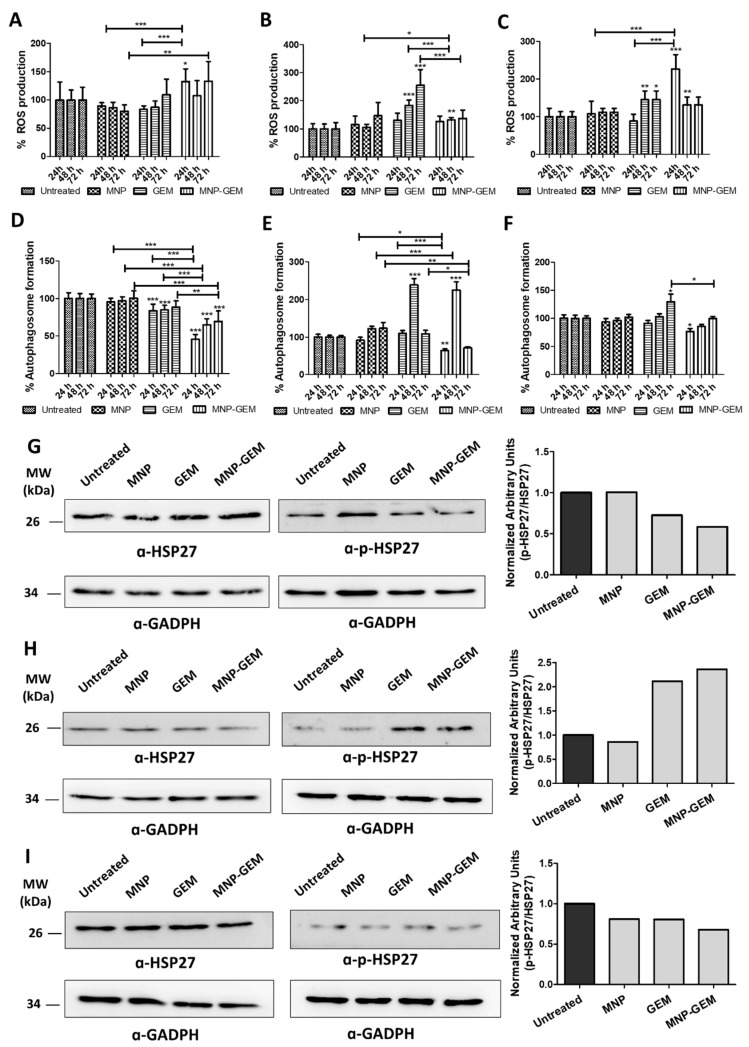
Figure 5.
(A–C) Quantification of ROS levels by the detection of oxidized DCF-DA 24, 48, and 72 h after treatment; (D–F) Quantification of autophagosome formation by measuring the fluorescence of MDC 24, 48, and 72 h after treatment. Data of: (A,D) PANC-1; (B,E) BxPC-3; (C,F) MIA Paca-2. Conditions in PANC-1: MNP 0.5 mg Fe/mL, GEM 22.5 µM and MNP-GEM 0.5 mg Fe/mL 22.5 µM. Conditions in BxPC-3 and MIA Paca-2: MNP 0.1 mg Fe/mL, GEM 4.5 µM and MNP-GEM 0.1 mg Fe/mL 4.5 µM. Data represent mean ± SD. Statistical analysis was performed using one-way ANOVA test (each group vs. control). * p < 0.05, ** p < 0.001, *** p < 0.001. (G–I) Analysis of HSP-27 phosphorylation in PANC-1, BxPC-3, and MIA Paca-2, respectively. Densitometry analysis plots show arbitrary units calculated as a p-HSP-27 signal normalized to a HSP-27 signal. Before p-HSP-27/HSP-27 normalization, p-HSP-27 or HSP-27 signal was normalized to the GADPH signal.

