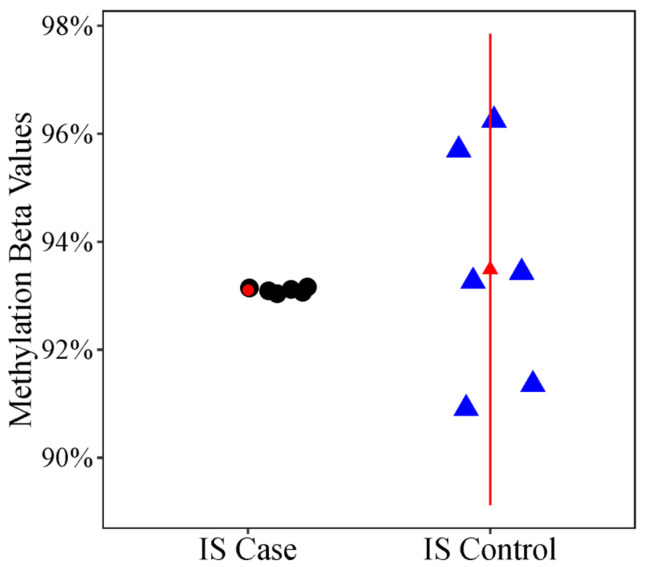
Figure 3.
Scatter Plot of Differential Variability Between Case and Control Twins. Methylation levels (% methylation or β values) at the cg12959265 probe, an open sea probe near the DPY19L1 gene on chromosome 7 in IS cases and IS controls. The triangle represents the mean % methylation and error bars represent +/− 1 standard deviation. The plot illustrates the large difference in variability at cg12959265 in IS cases vs. IS controls.

