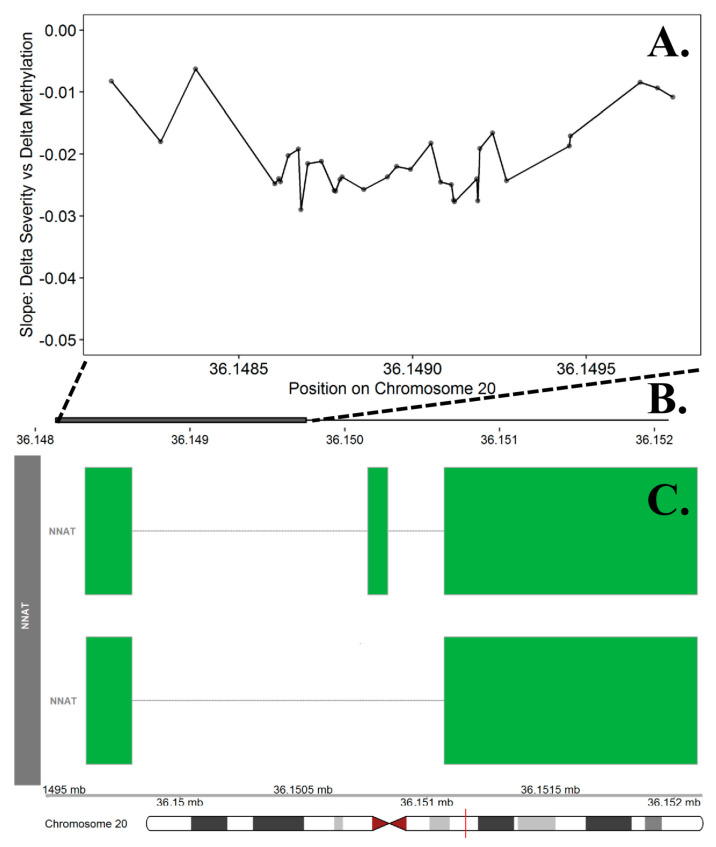
Figure 5.
Differentially Methylation Region in the NNAT Promoter Region on Chromosome 20. The top panel (A) presents the slope estimates from the curve severity analysis that represent the change in methylation between cases and controls per one-degree change in curve severity at each of the 34 probes included in the promoter region for the NNAT gene. This region was the most significant DMR in the curve severity analysis. The X axis represents the position (mb) of the probes. The middle panel (B) represents the location of promoter region (solid square) relative to the entire gene, represented in the bottom panel. Multiple known isoforms of the NNAT gene are represented in the bottom panel (C), boxes represent exons and lines represent introns. The red line on the ideogram, bottom of the figure, represents location of the region within the chromosome.

