Figure 5.
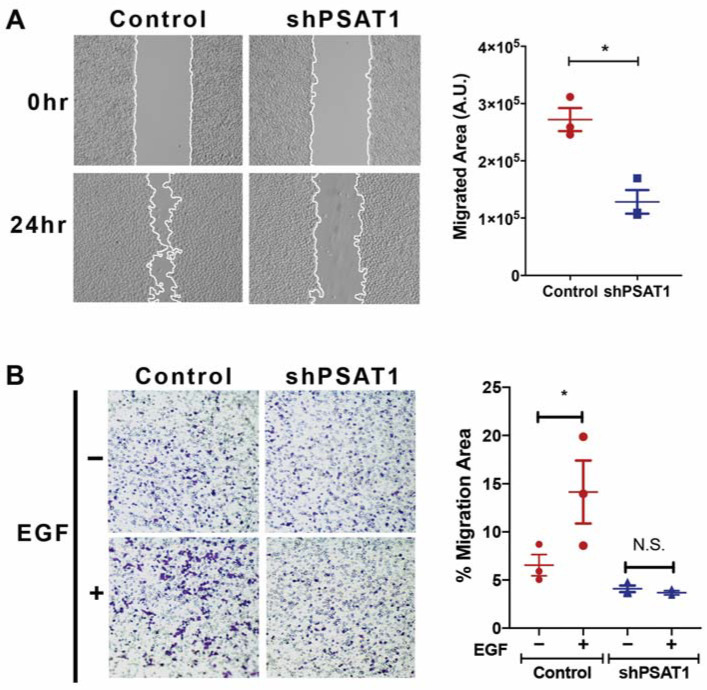
Loss of PSAT1 decreases cell migration in EGFR-mutant PC9 and EGF-stimulated A549 NSCLC cells. (A) Wound healing assay of PC9 cells expressing the control or PSAT1-specific shRNA. Shown are representative images taken at 0 h and 24 h. Migrating cells are demarcated by continuous white lines. Data are presented as a migrated area after 24 h and shown is the mean ± SE from three independent experiments. A statistical significance was determined by a paired t-test analysis. * is p < 0.005. (B) Boyden chamber migration assay on serum-starved A549 cells expressing the control or PSAT1 shRNA. A total of 100 ng/mL EGF serum-free media was used as a chemo-attractant and migrated cells were fixed and stained with crystal violet after 24 h. Shown are representative images of the migrated cells and quantification is demonstrated as the mean ± SE of the% migration area from three independent experiments. A statistical significance was determined by a two-way ANOVA with Tukey’s multiple comparison test. * p = 0.0001. N.S.: not significant; A.U.: arbitrary unit.

