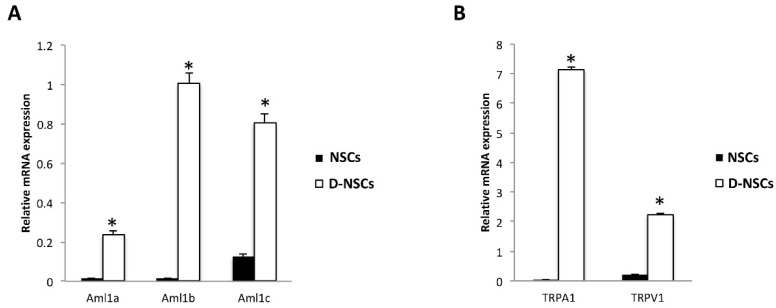
Figure 1.
Phenotype characterization of NSCs: (A) The relative Aml1 isoforms mRNA expression in NSCs (NSC#1 and NSC#2) and D-NSCs (D-NSC#1 and D-NSC#2) evaluated by qRT-PCR. (B) The relative TRPA1 and TRPV1 mRNA expression in NSCs (NSC#1 and NSC#2) and D-NSCs (D-NSC#1 and D-NSC#2) evaluated by qRT-PCR. AML1, TRPA1 and TRPV1 mRNA levels were normalized for GAPDH expression. Data are expressed as mean ± SD.* p < 0.001 vs. NSCs.

