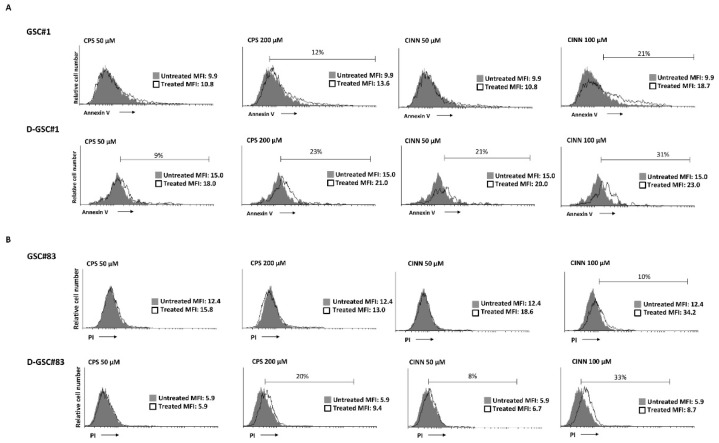
Figure 6.
Phenotype characterization of NSCs: (A) Annexin V staining was analyzed by flow cytometry in in GSC#1 and D-GSC#1 at 7 days of differentiation, treated with CPS (50 and 200 μM) or CINN (50 and 100 μM) for 24 h. A representative one out of three experiments have been shown. Percentages represent the positive cells. MFI = mean fluorescence intensity. (B) The cytotoxic effects in GSC#83 and D-GSC#83 at 7 days of differentiation, treated with CPS (50 and 200 μM) or CINN (50 and 100 μM) were determined by PI staining and cytofluorimetric analysis assay. A representative of three experiments has been shown. Percentages represent the positive cells. MFI = mean fluorescence intensity.

