. 2021 Aug 10;10:e71888. doi: 10.7554/eLife.71888

Figure 1. Phenotypes of NM IIA, NM IIB, and NM IIC-KO cell lines on homogenously coated substrates are very distinct.

(A) U2OS WT cells show a polarized phenotype with prominent dorsal stress fibers (dSF) (1), transverse arcs (tA) (2), and ventral stress fibers (vSF) (3). Mature focal adhesions (FA) are visualized by elongated paxillin clusters that localize at the distal ends of dSF or both ends of vSF. (B) The NM IIA-KO leads to drastic morphological changes and the loss of most SFs and mature FAs. The overall actin structure resembles a dense meshwork of fine actin filaments (1). At the trailing edge, long cell extensions remain (2) and the only bundled actin fibers resemble vSF (3). (C) NM IIB-KO cells reveal slight changes in SF organization and FA structure. dSF (1), tA (2) and vSF (3) are present but their distinct localization pattern is disturbed. (D) The phenotype of NM IIC-KO cells is comparable to the WT. dSF (1), tA (2) and vSF (3) localize in a distinct pattern along the cell axis of polarized cells. (E) The mean FA area per cell is reduced for NM IIA-KO and NM IIB-KO cells, whereas FA density is only reduced in NM IIA-KO cells (F). Scale bars represent 10 µm for overviews and 2 µm for insets of (A) - (D).

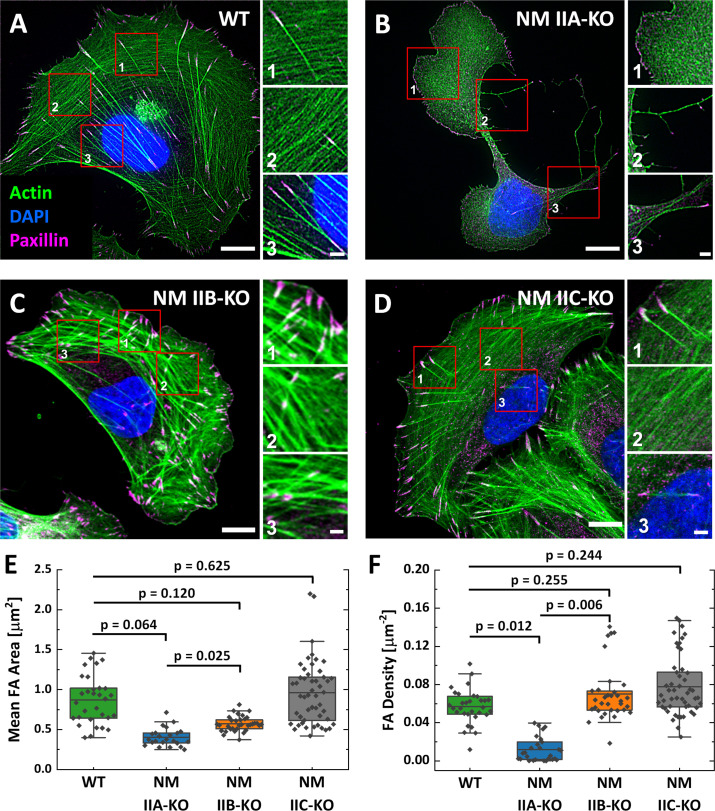
Figure 1.

Figure 1—figure supplement 1. Knockout of NMHC IIA, NMHC IIB and NMHC IIC via CRISPR/Cas9.

Figure 1—figure supplement 1.

NM II-KO cell lines were generated via CRISPR/Cas9 and the loss of protein expression was confirmed via western blot (A) and immunofluorescent labeling (B). Deletions in the coding sequences of the first coding exons (exon 2) of NMHC IIA (C) and NMHC IIB (D) lead to frame shifts and premature stop codons in corresponding protein sequences (marked by asteriscs). Scale bar represents 20 µm.
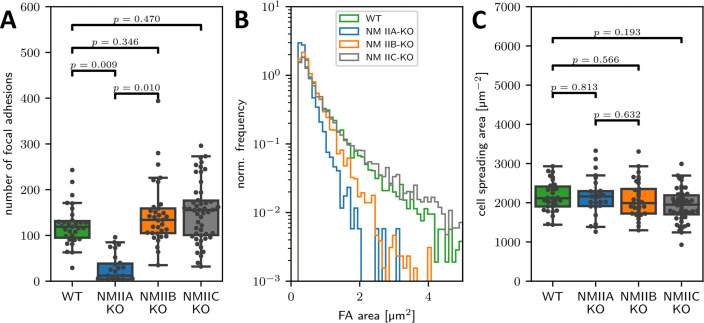
Figure 1—figure supplement 2. Quantification of FA number and cell spreading area.

Figure 1—figure supplement 2.

Quantifications showing the number of focal adhesions (A), their size frequency (B), and the cell area (C) of WT and the respective NM II-KO cell lines. (A) NM IIA-KO cells show a reduced number of mature focal adhesions (larger than 0.25 µm²), while no difference was observed for NM IIB-KO and NM IIC-KO cells. (B) The frequency distribution of FAs is shifted to smaller sizes in NM IIA-KO and NM IIB-KO cells as compared to WT cells. No difference was observed for NM IIC-KO cells. (C) The cell spreading area is not affected by the loss of NM IIA, NM IIB, or NM IIC.
Figure 1—figure supplement 3. Paralog localization in NM II-KO cells.

Figure 1—figure supplement 3.

Immunfluorescent labeling was used to analyze the localization and intensity of the NM II paralogs in U2OS WT or the respective NM II-KO cells. (A) In polarized WT cells, all isoforms co-localize with actin fibers throughout the cell body (NM IIA and NM IIC) or in the cell center (NM IIB). (B) In NM IIA-KO cells, the remaining paralogs show an altered localization pattern: NM IIB and NM IIC minifilaments are clustered along the remaining SFs in the cell center. (C) In NM IIB-KO cells, NM IIA and NM IIC minifilaments still localize throughout the cell body, comparable to WT cells. (D) The loss of NM IIC did not change the localization of the remaining paralogs. NM IIA is homogenously distrubuted and NM IIB accumulates in the cell center. (E) The mean fluorescence intensities of NM IIA-C was measured along segmented actin fibers and the fold change to the WT was calculated. All scenarios resulted in only mild intensity increases and no significant differences were observed. Scale bars represent 10 µm in (A)-(D).
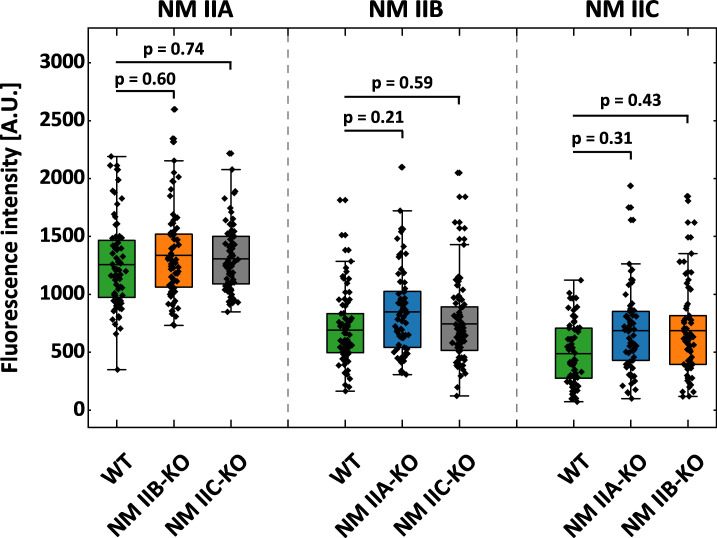
Figure 1—figure supplement 4. Intensity quantification of NM II-paralogs.

Figure 1—figure supplement 4.

Segmented actin fibers were used to determine the fluorescence intensities of NM IIA-C in WT and the respective NM II-KO cells. Shown are the absolute intensity values, used to calculate the fold changes in Figure 1—figure supplement 3E.